C mini program design
ETStudio's mini program function, built-in open source vs code, strong scalability, theoretically supports all languages, in order to cope with the current user usage habits, now mainly supports C++ and C language mini program design compilation and running. Mini programs use the standard C/C++ compiler. In addition to using the function interface provided by the software, users can also refer to Windows system resources or other existing library files for arbitrary extensions.
The main purpose of the mini program
Mini programs can be said to be extremely important functions of ETStudio, enabling ETStudio to meet the needs of simulation, analysis and testing and diagnostic complex requirements, while allowing ETStudio's capabilities to be continuously expanded. wraparound The main uses of mini programs are as follows.
(1) Use an easy-to-understand programming language to simulate nodes or modules;
(2) Simulated event messages, periodic messages, or duplicate messages with additional conditions;
(3) Use PC keyboard to simulate manual operation events such as operation buttons;
(4) Timing or network events of simulated nodes;
(5) Simulate multiple time events, each event has its own specific behavior;
(6) Simulate ordinary operations, diagnoses or production operations;
(7) Changes in simulated physical parameters or packets;
(8) Simulate module or network errors to evaluate the relevant error prevention mechanism;
(9) Provide functional test library functions such as network testing and diagnosis.
Introduction to Code Editor Browser
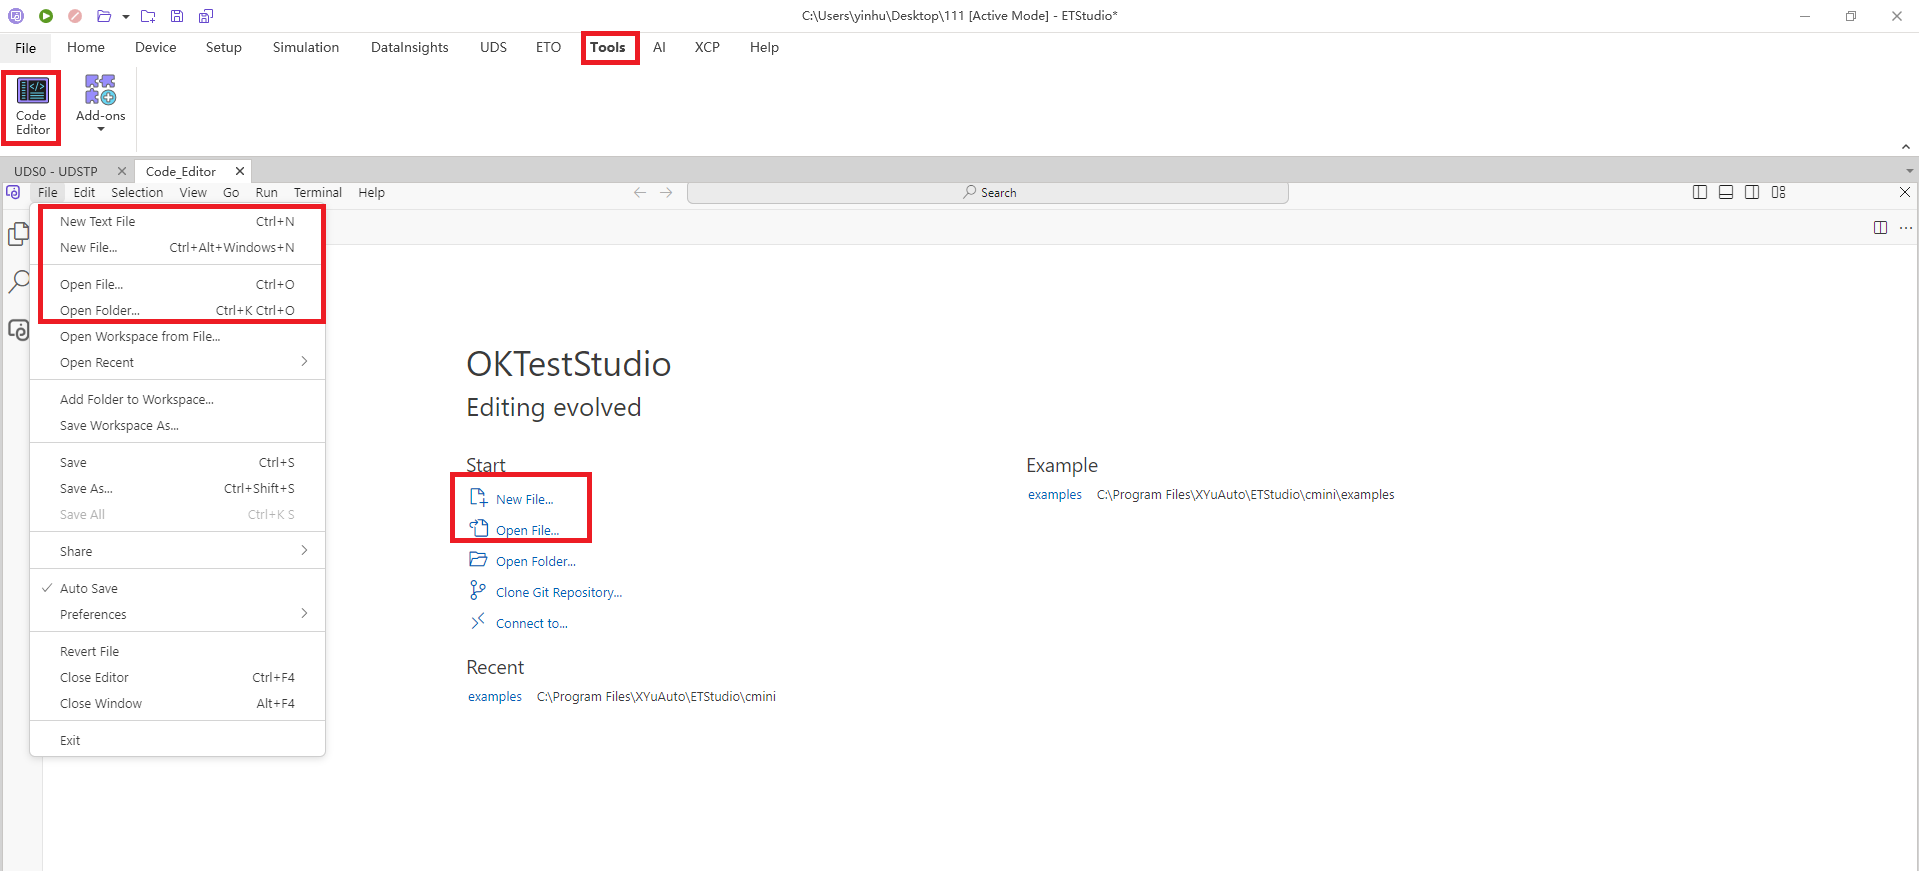
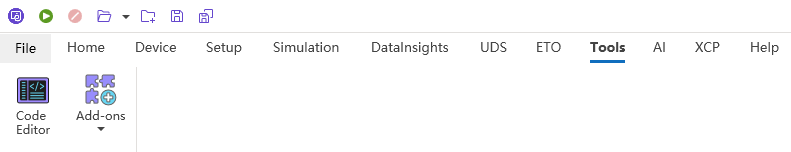
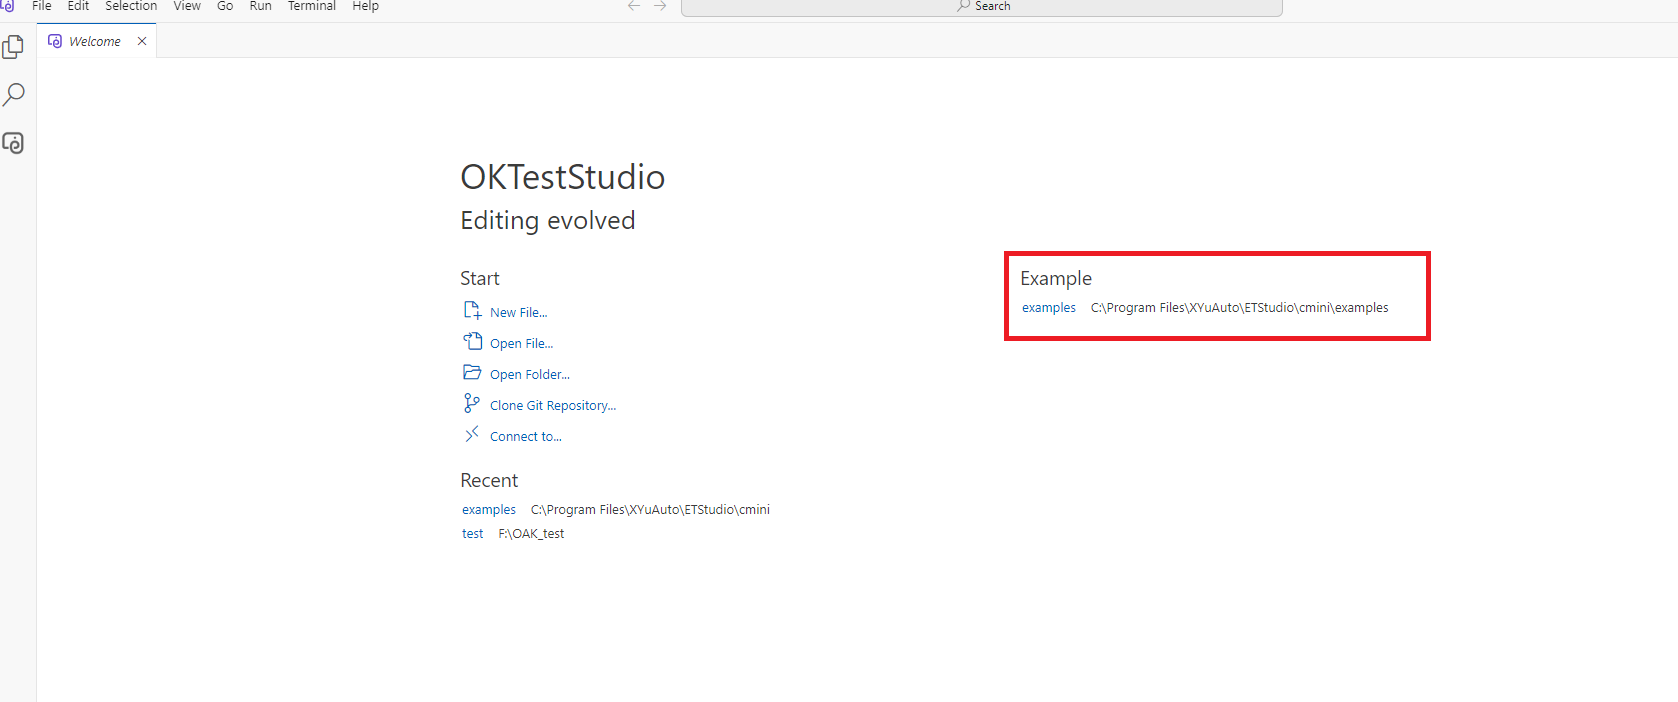
You can click the Code Editor icon under the Tools menu to open the Code Editor interface.
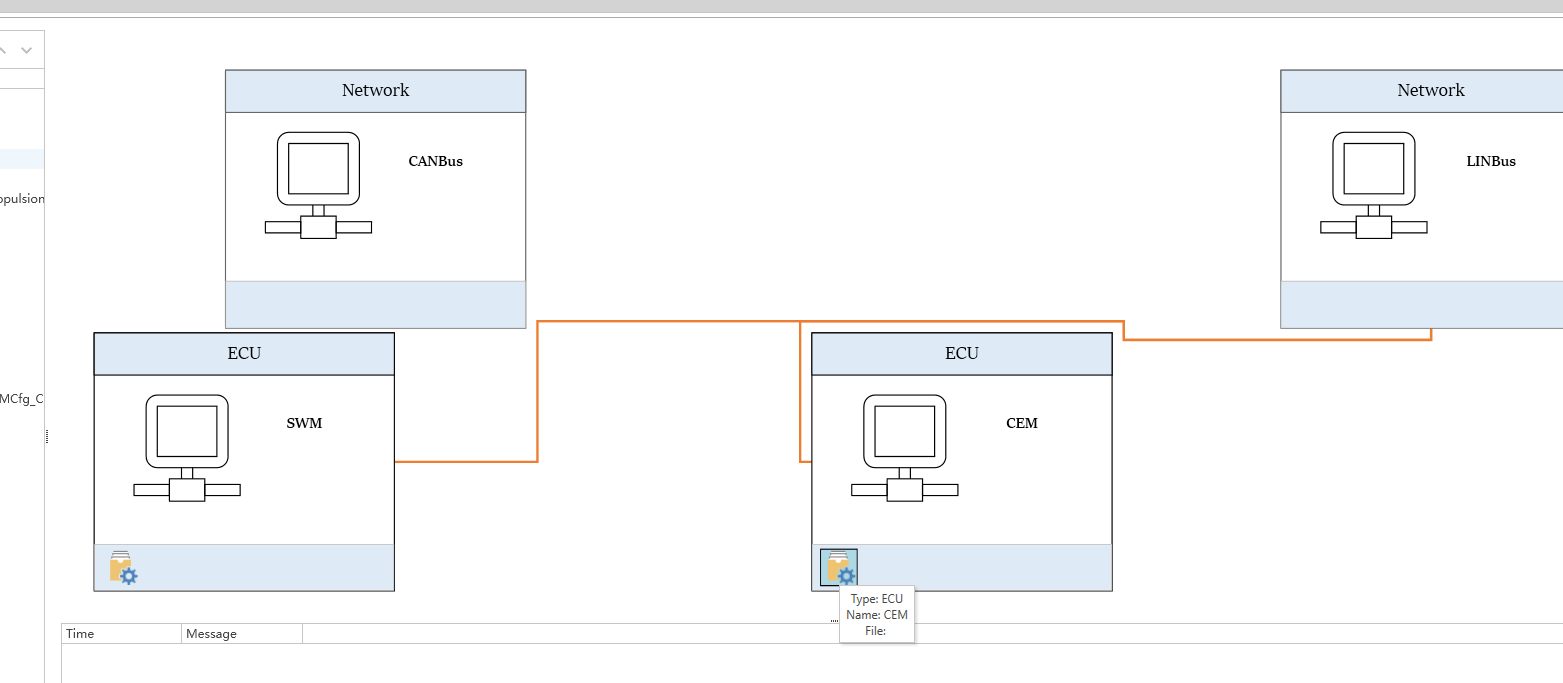
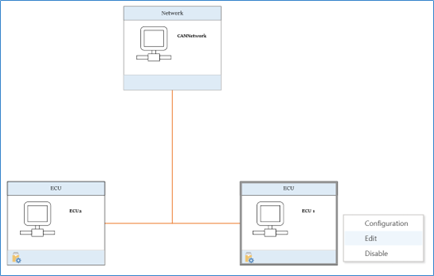
You can also double-click on a Node or right-click Node->Editor to open the Code Editor interface.
Interface features
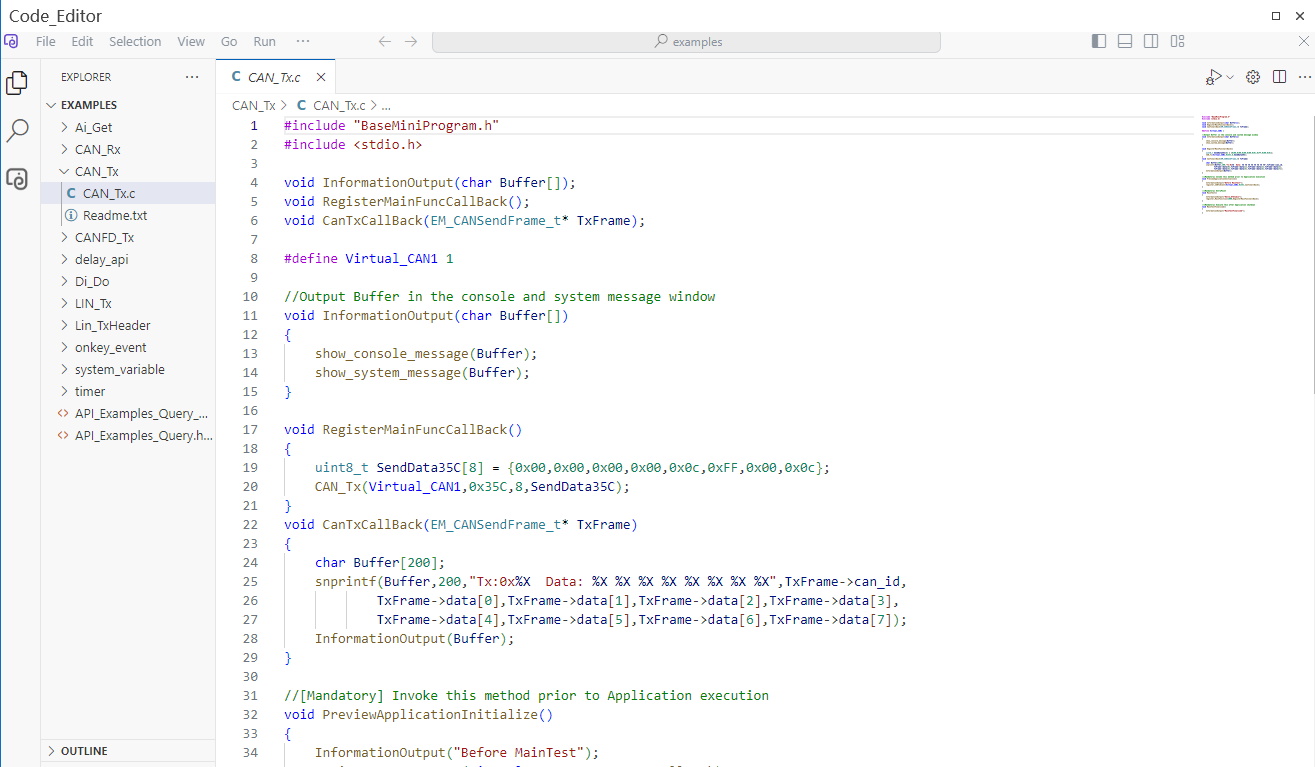
1.Activity bar
Position: Vertical bar on the left side of the interface.
Features: Includes multiple icons for quick access to core features:
File Explorer (file icon): Browse project folders, files, and manage file structure.
Search (magnifying glass icon): Search for code or files within your project.
Source control (branch icon): Integrate Git for version control operations (such as commit and push).
Run and debug (play/bug icon): Run code or debug program.
Extensions (square icon): Browse and install plugins to extend VSCode functionality.
Operation: Click the icon to switch the function dashboard, and right-click to customize the order of the activity bar.
2.Sidebar
Position: Immediately on the right side of the activity bar, the content of the specific function is displayed.
Function: Displays the corresponding function according to the icon selected in the activity bar. For example:
File Explorer: Displays the folder structure and allows you to create, delete, and rename files.
Extended Marketplace: Search, install, and manage plugins.
Operation: Drag the edge of the sidebar to adjust the width, or tap the activity bar icon to switch the content.
3.Editor area
Position: The center of the interface, occupying the largest space.
Function: Core code editing area, support multiple files to open side by side.
Tabs: Each open file appears as a top tab, which can be toggled or closed.
Split Editor: Right-click on the tab and select "Split Editor" to edit multiple files simultaneously.
Code highlighting/completion: Automatically highlight syntax and provide code completion according to the language.
Operation: Drag tabs to adjust the order of files, Ctrl+Tab to quickly switch files.
4.Status bar
Location: Bottom of the interface.
Function: Displays status information for the current file or editor:
File encoding (e.g. UTF-8)
Language mode (e.g. Python, JavaScript, click to switch languages).
Row/column number: Displays the location of the cursor.
Notification bell: Displays errors, warnings, or task statuses.
Action: Click on the status bar element to quickly adjust settings, such as changing the file encoding.
5.Command dashboard
Function: The core operation portal of VSCode can execute various commands.
How to open: Press Ctrl+Shift+P or click on the menu bar "View" -> "Command dashboard".
Usage: Enter commands (e.g., "configure display language", "install extension") to perform actions quickly.
6.Menu bar
Location: Top of the interface (some Linux distributions may be hidden by default, mouse hover display).
Functions: Contains menus such as File, Edit, Select, View, Go, Run, Terminal, Help, etc.
Usage: Used for operations such as creating new files, saving, running tasks, and opening settings.
7.Terminal
Location: Below the editor (hidden by default).
Function: Built-in terminal, support running command line operations (such as npm install, python script.py).
Open by: Menu 'View' -> 'Terminal' or press 'Ctrl+'.
Operation: You can create multiple terminals and switch between bash, PowerShell, etc.
8.Customize the interface
Theme: Enter "theme" in the command dashboard and select your favorite theme (e.g., Quiet Light, Light).
Layout: Drag the activity bar to the right, or adjust it by "View" -> "Switch Active Bar Position".
Font/Zoom: Menu File -> Preferences -> Settings, search for Font or Zoom adjustments.
Shortcuts: Enter "Keyboard Shortcuts" in the command dashboard to view or customize shortcuts.
9.Practical tips
Multi-cursor editing: Press Alt+Click or Ctrl+Alt+Up and Down arrows to add multiple cursors and edit multiple rows at the same time.
Code fold: Click the collapse icon (+/-) on the left side of the code to collapse or expand the code block.
Quickly open the file: Press Ctrl+P and enter the file name to open it quickly.
Create a mini program with the most basic structure and execute it
Under the File menu, click the New File button and enter a mini program name such as test.cpp or test.c
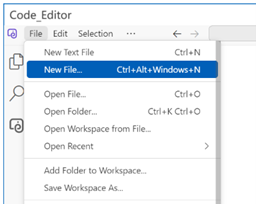

Then a new mini program file will be created.
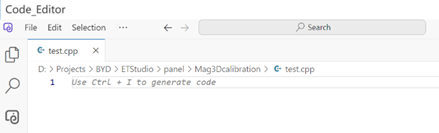
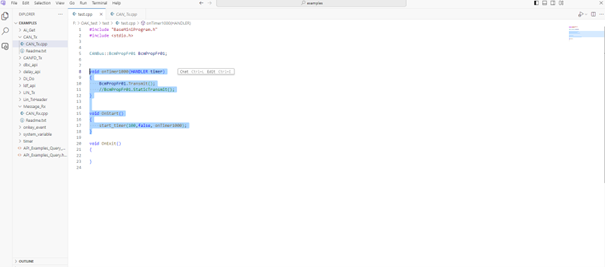
A minimal unit C applet is shown below, the file extension must be .cpp, and the code should be compatible with both C and C++.
#include "BaseMiniProgram.h"

void OnStart(){

}
void OnExit(){

}
Add some sample code to the above code, show_console_message indicate that the print information to the debug window is as follows:
#include "BaseMiniProgram.h"

void OnStart(){
    show_console_message("started application...\n");
}
void OnExit(){
    show_console_message("finished application...\n");
After running the mini program, first execute the statement in the OnStart() function, when the program stops, execute the OnExit() function, start the host computer software, and then stop the host computer after the above code runs, and the whole process will print the following information in the console window:

Access to global variables
1.Suppose the current global variables are as follows, where NameSpace is Test, Name is Button_1 and Led_1, respectively
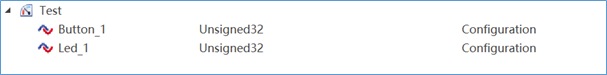
You need to include the header file related to the global variable in the mini program, as shown below:
#include "BaseMiniProgram.h"
#include "SystemVariable.h"  //小程序的操作系统变量头文件

void OnStart(){
    show_console_message("started application...\n");
}
void OnExit(){
    show_console_message("finished application...\n");
}
2.If you want to assign values to system variables, use the following format: namespace: variablename = newvalue:
Test::Button_1 = 1;
3.If you want to read the value of a system variable, use the following format: value = namespace:variablename:
testvalue = Test::button_1;
Access to DBC and packet signals
Message sent
1.Imported by dbc/ldf file
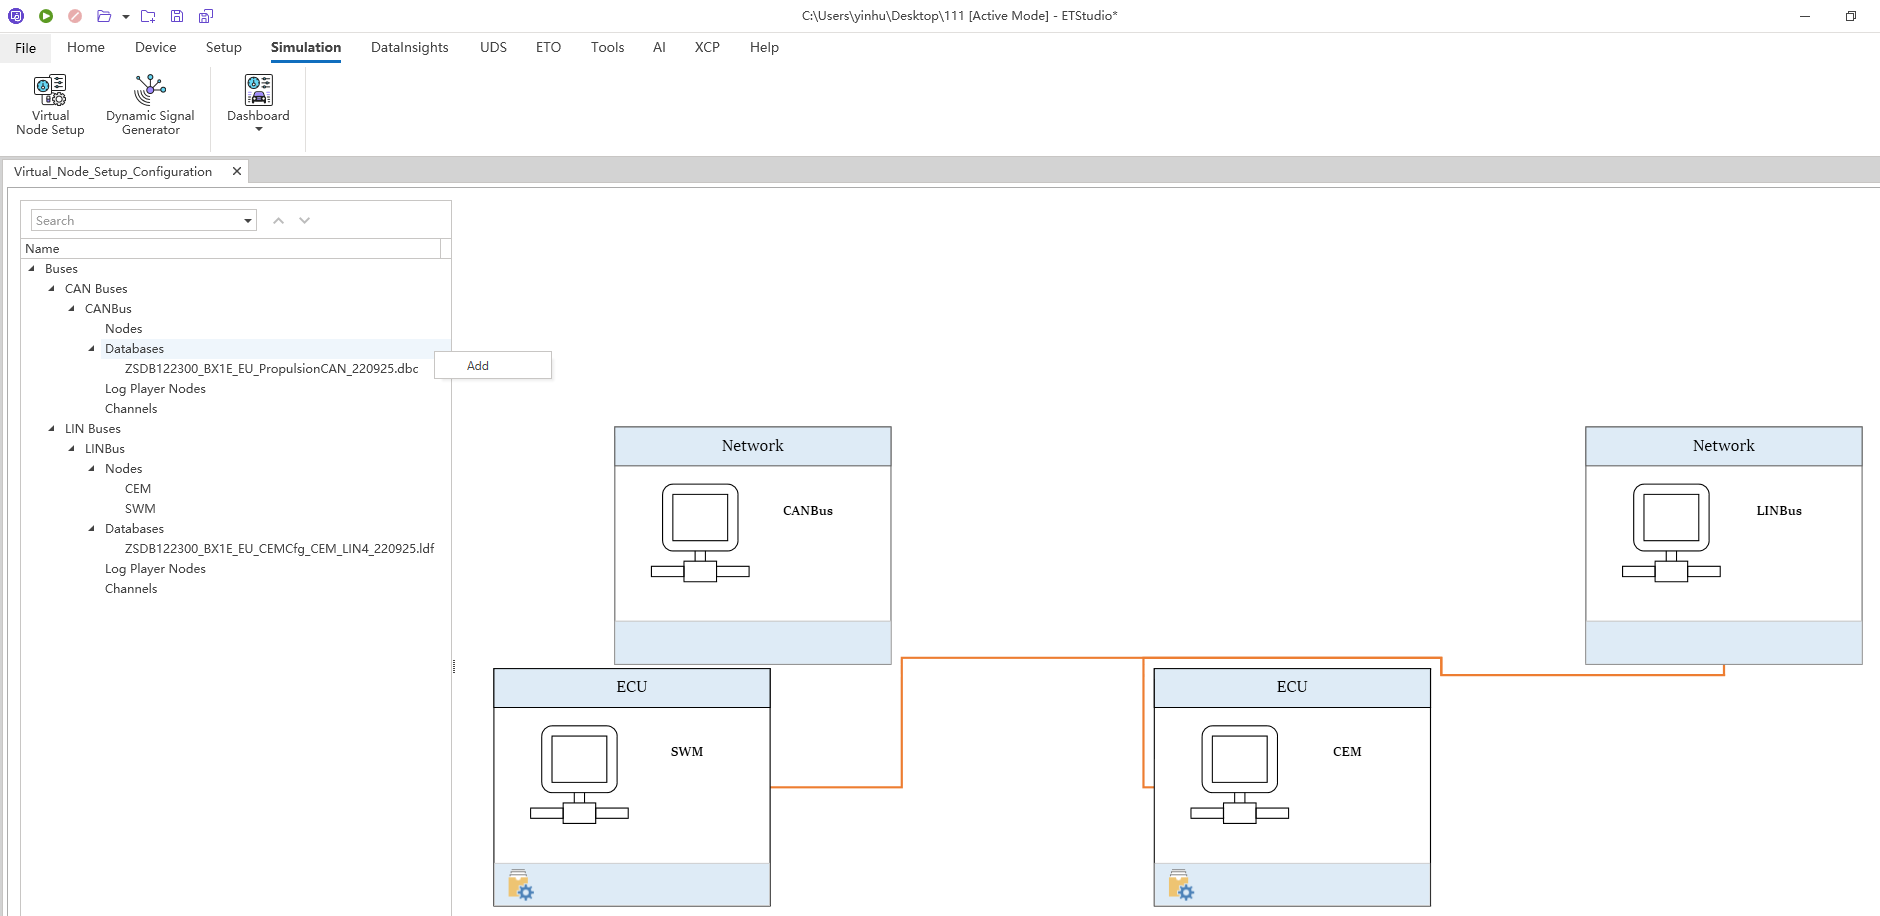
Click Add and select the dbc file, and the same applies to the ldf file below.
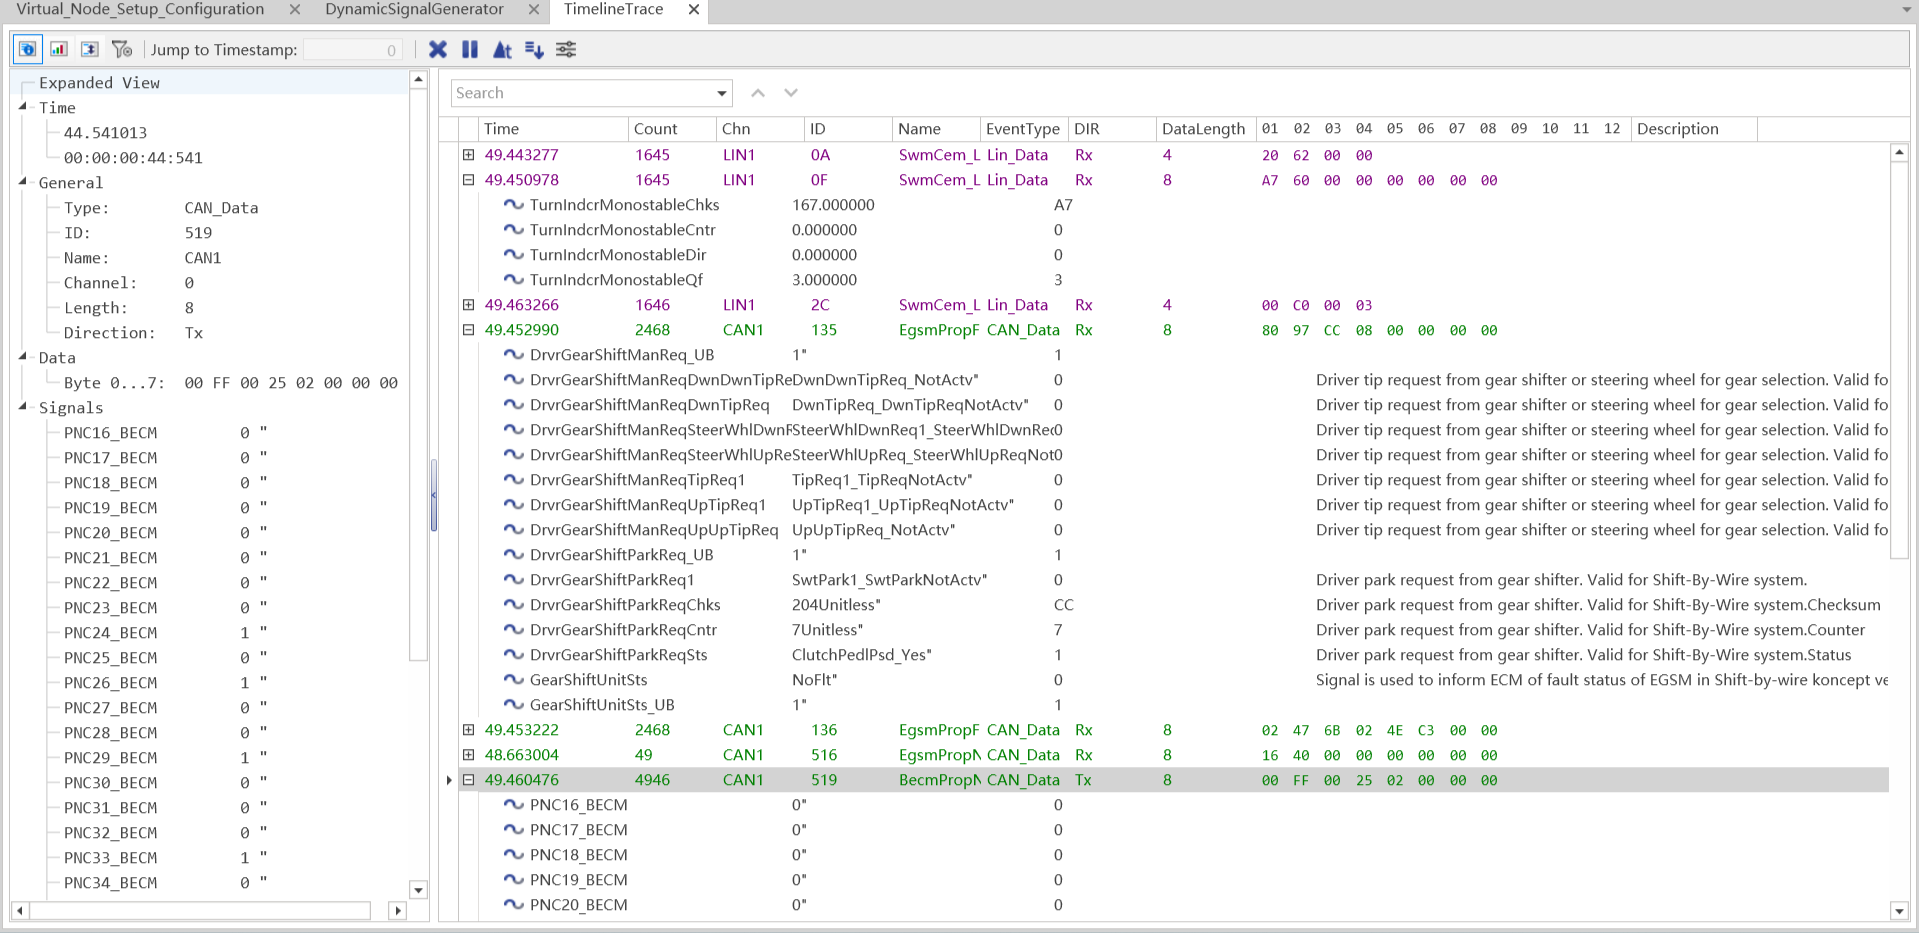
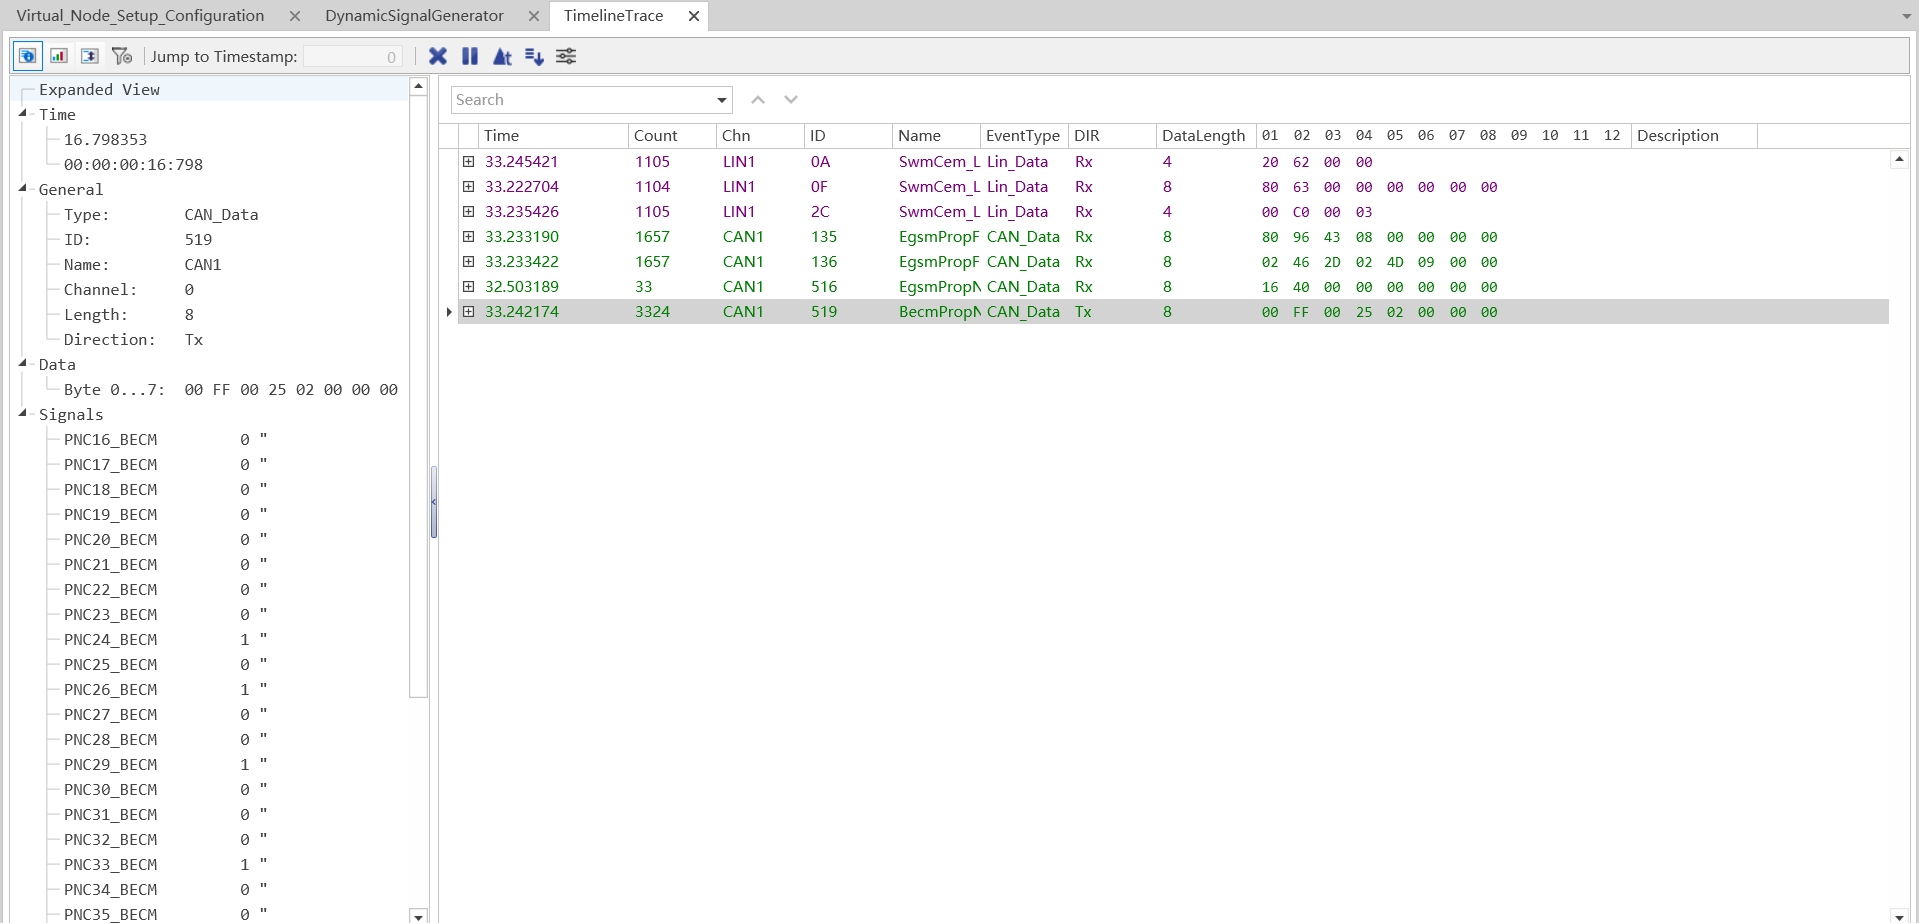
Packet Receiving Events
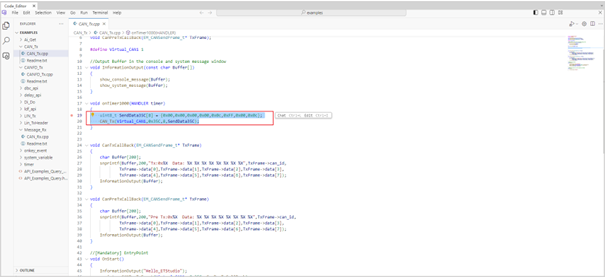
Packet definition and sending
Refer to the definitions and sending in the C mini-program sample.
Event types and usage
The specific code configuration can be referred to in the example.
Use of timers
Refer to the definitions and sending in the C mini-program sample.
Interaction between the mini program and the dashboard

Mini program compilation and debugging
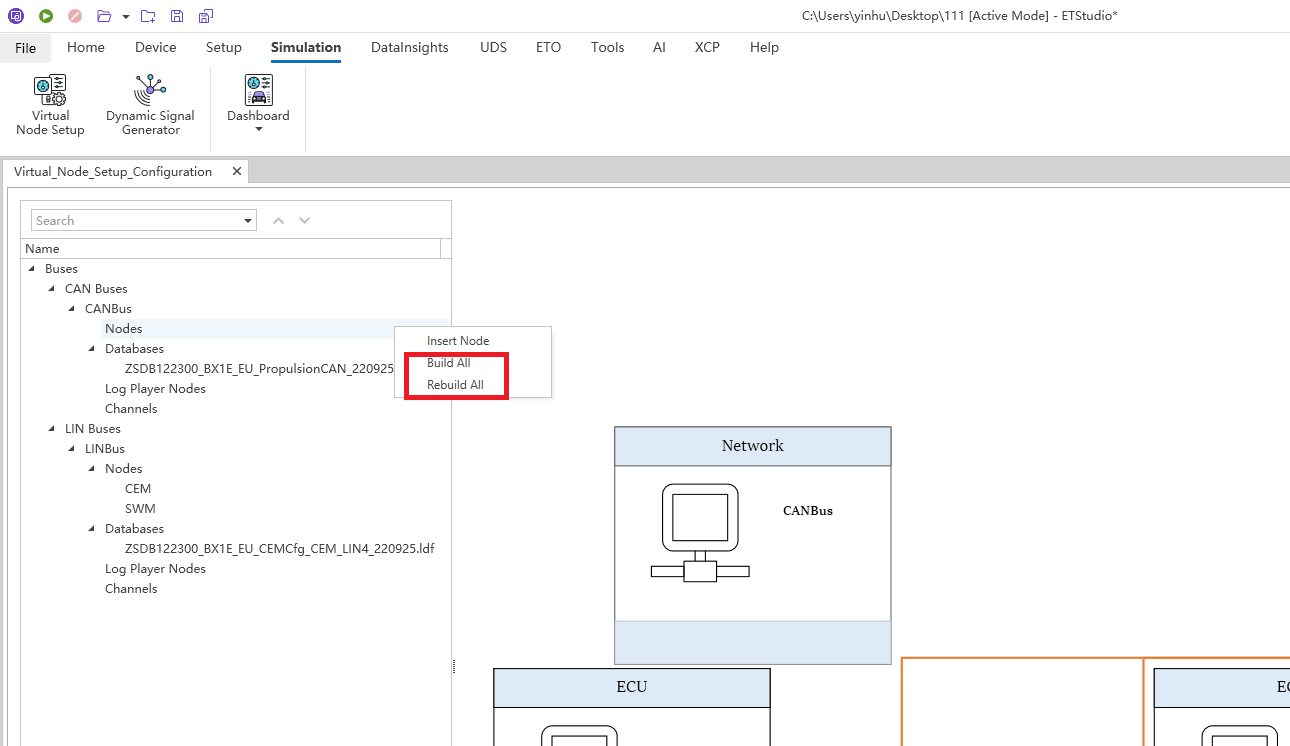
The method of binding scripts to nodes: compile successfully first, then start the project.
To run it, first start the project.