Trace Operation Manual
1. Function Overview
Trace is used to view, pause the analysis and conduct offline playback of bus or system event data in real time. Users can view information such as message time, channel, ID, name, direction, length, data content, signal analysis results, etc. in the Trace window, and quickly locate the target message through functions such as search, column filtering, analysis filtering, time mode switching, and display mode switching.
Currently, the Trace window mainly supports the following data types:
CAN_LIN:CAN, CAN FD, LIN and other bus messages.DDS:DDS-related incidents.SYS:System variables or system events.
2. Open Trace
- Start ETStudio and open the project.
- Enter the analysis-related page within the Ribbon on the main interface.
- Click the
Timeline Tracebutton to open the Trace window. - After the measurement begins, Trace will automatically refresh and display the received messages or events.
You can also import offline log files for viewing through the right-click menu of the Trace window. These files support the formats of .asc and .blf.
3. Interface layout
The Trace window consists of three parts:
- Top toolbar: Offers operations such as view switching, filtering, clearing, pausing, time mode, display mode, diagnostic filtering, protocol selection, etc.
- Left auxiliary view: Based on the current button, it displays "Expanded View", "Analytics view", "Delta View" or "Data Filter".
- Right-side Trace table: Displays the main content of Trace data, supporting search, column filtering, copying, import/export, and expansion of signal details.
There is a draggable divider between the left and right sides. Clicking on the divider will collapse or restore the left view, and dragging the divider will adjust the width.
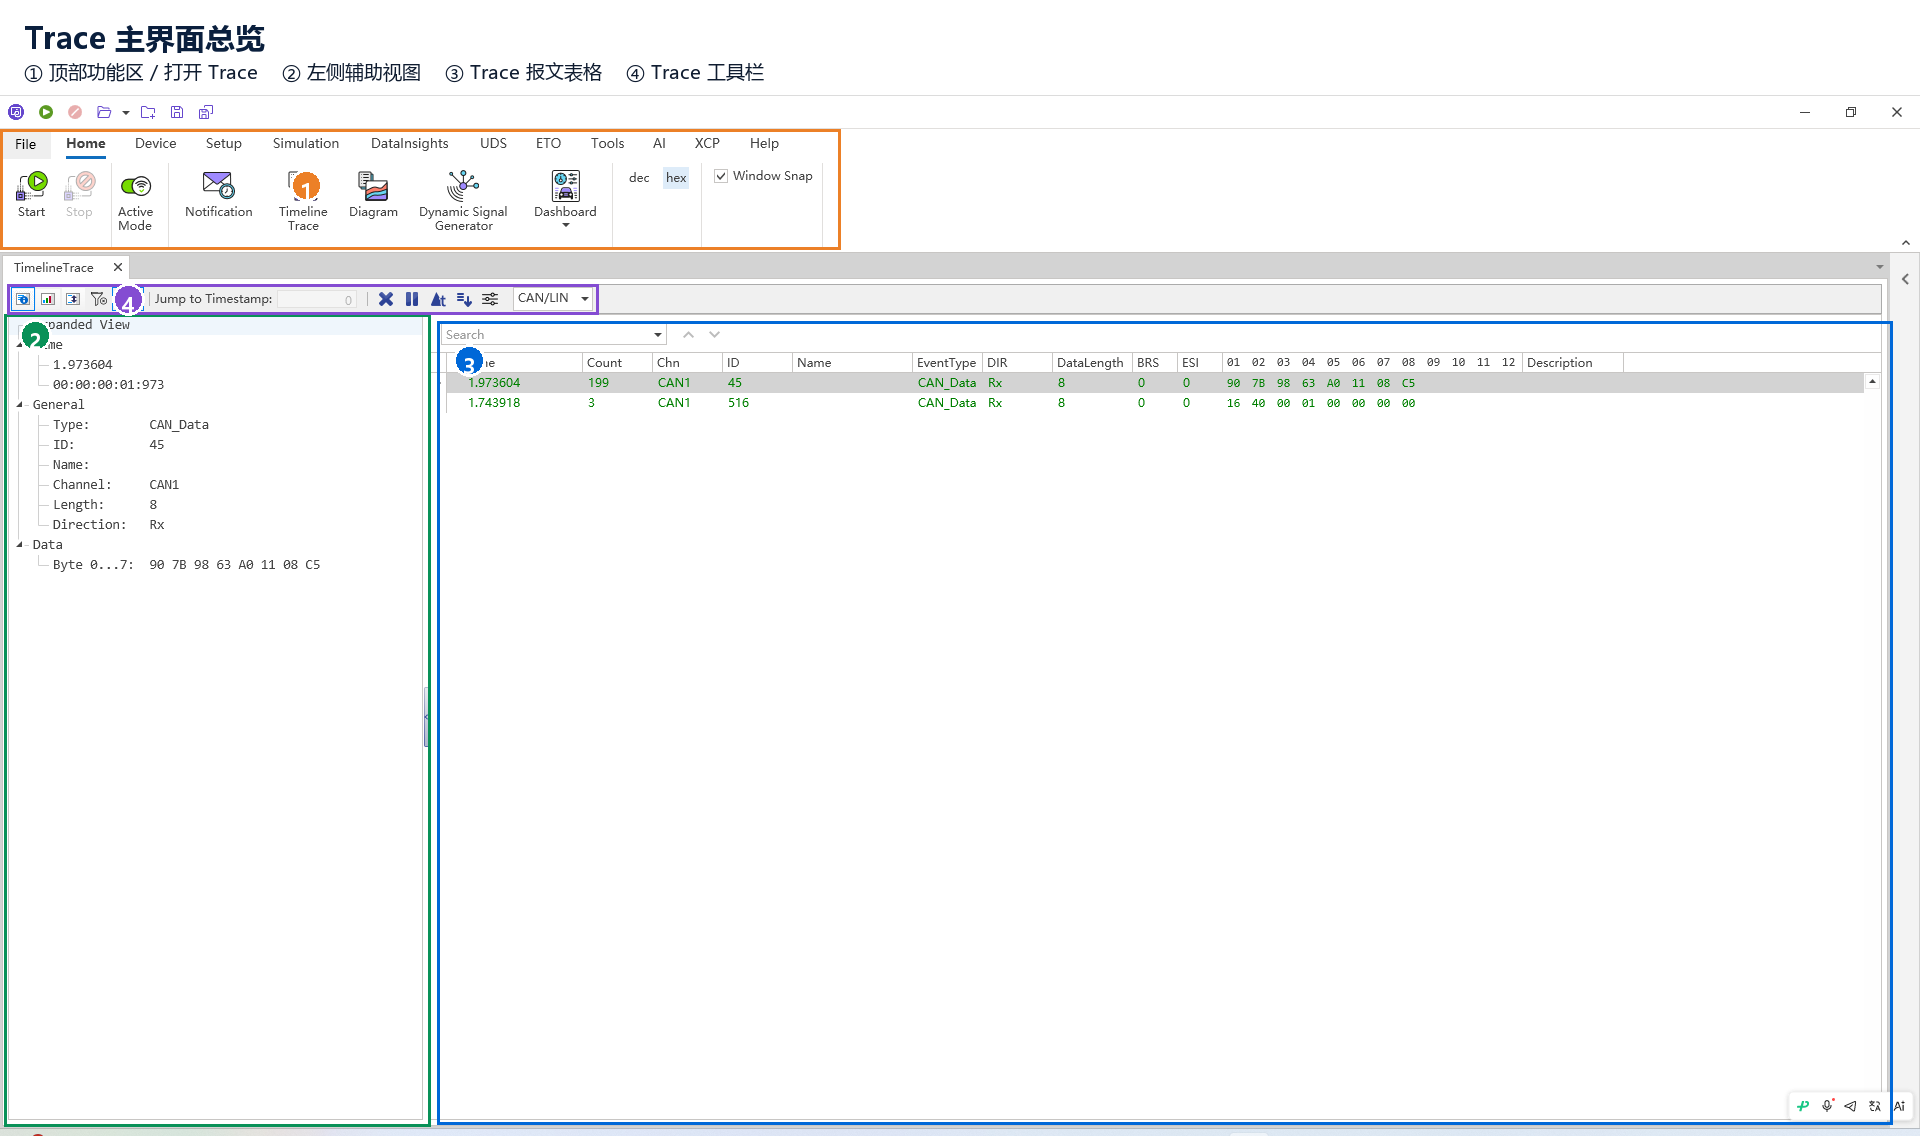
Figure 1: Overview of the Trace main interface, including the top function area, Trace toolbar, left auxiliary view, and right message table.
4. Description of Top Buttons
4.1 Expanded View
Button prompt: Expanded View
It is used to display the detailed view of the message on the left. After selecting a message in the Trace table, the left side will show the detailed content of that message. For messages with interpretable signals, you can view the signal name, physical value, original value and description information.
Applicable scenario: Required to view the detailed fields or signal analysis results of a single message.
4.2 Analytics view
Button prompt: Analytics view
It is used to record the time interval and signal value of the currently selected message. After clicking this button, a statistics table will be displayed on the left side; then, by selecting one or more messages in the Trace table on the right side, the statistics results will be automatically updated.
The statistical table contains columns such as Analytics View, Minimum, Maximum, Average, and Count. Common results include:
Time difference: Calculates the minimum, maximum and average time intervals between the selected messages.- Signal name: If the message can be parsed as a signal, it will calculate the minimum, maximum, average value and quantity of the signal values.
Applicable scenarios: To check whether the cycle of the same type of messages is stable, or to observe the variation range of a certain signal within a set of messages. It is recommended to first switch to the "Expanded Mode" and then select multiple actual messages for statistics.
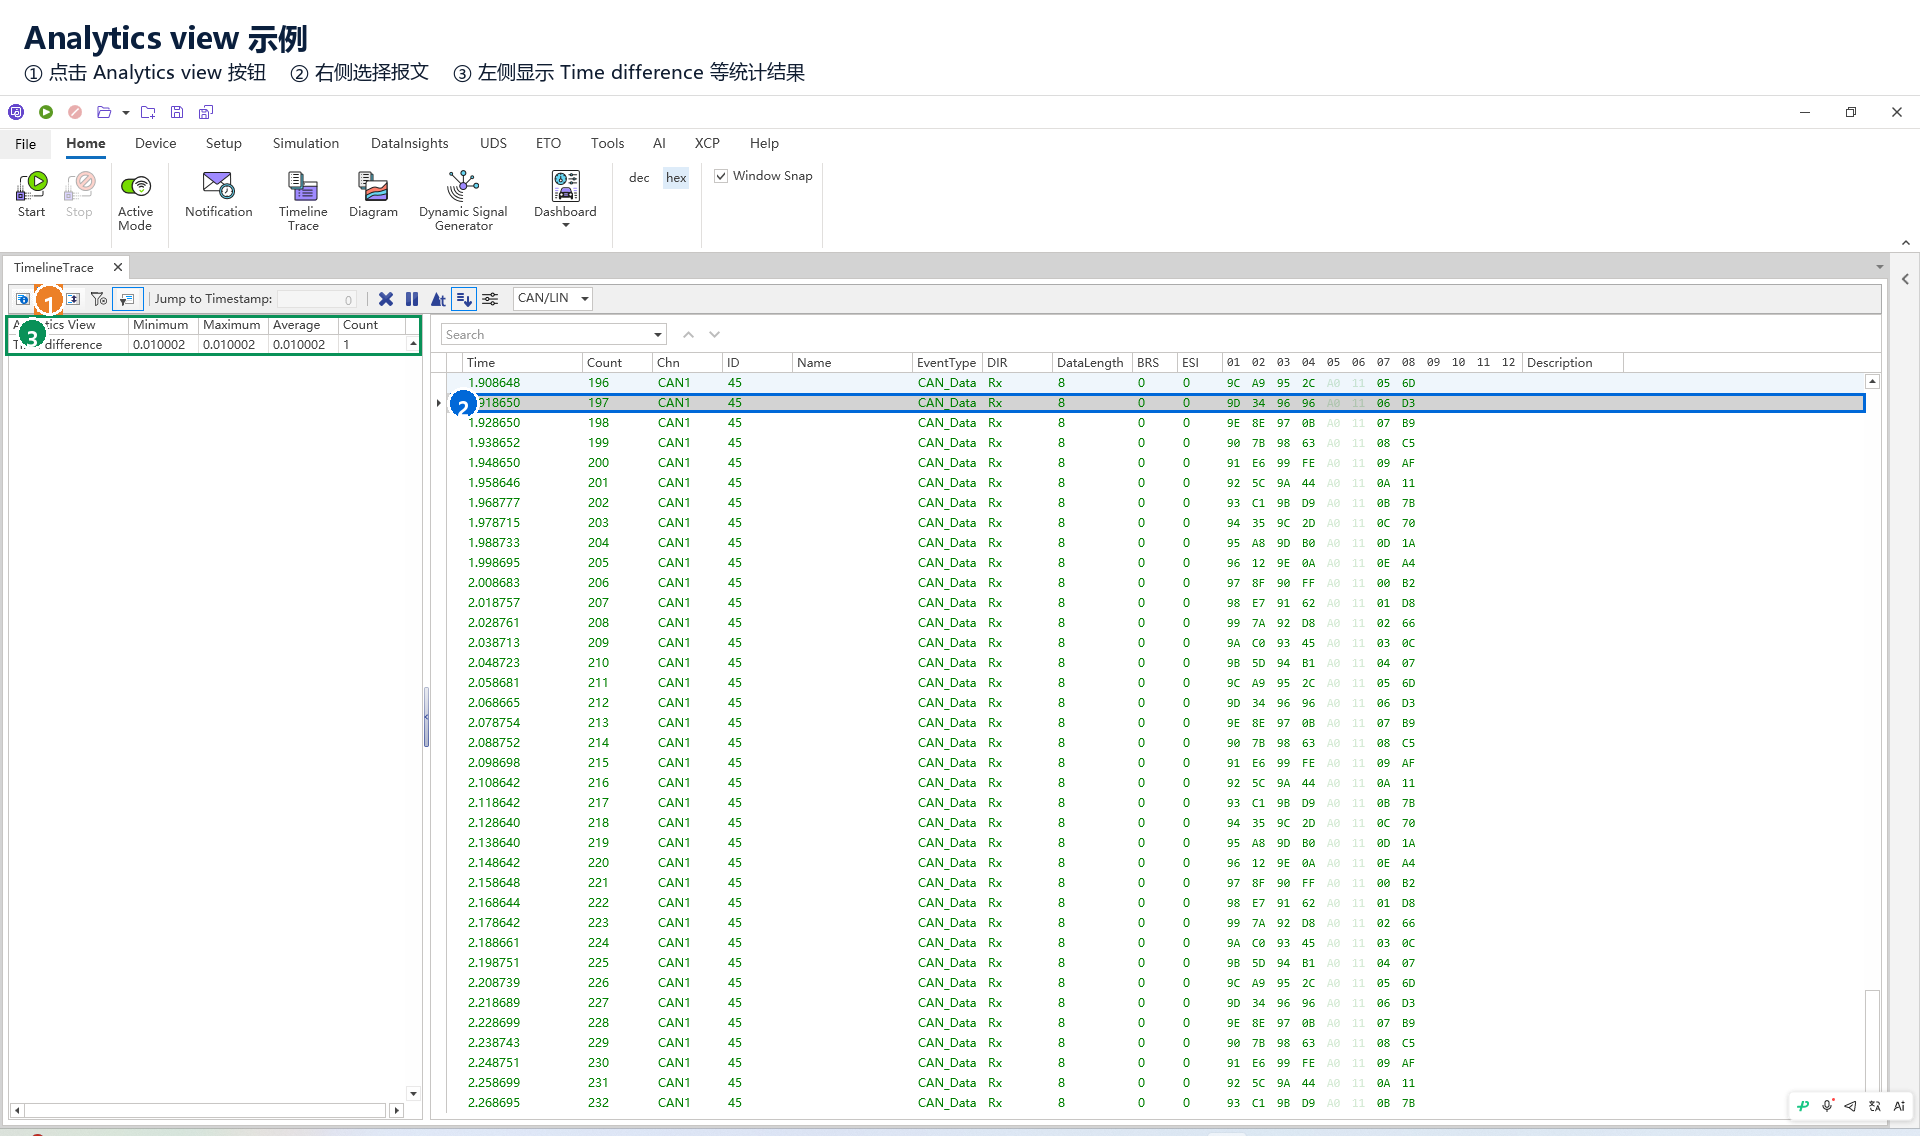
Figure 2: The Analytics view will update the statistical results based on the currently selected message on the right side.
4.3 Delta View
Button prompt: Delta View
Used to display the difference view. After selecting a message, it can be used to observe the content of the message or the changes in signals, which is helpful for analyzing the changes between adjacent or related messages.
Applicable scenarios: Identifying signal variations, data jumps or message discrepancies.
4.4 Data Filter
Button prompt: Data Filter
Used to open the left-side data filtering configuration panel. The filtering panel contains a "Filter Group", which is further divided into:
Stop Filter: Messages that match the criteria will be filtered out and will not be displayed in the Trace table.Pass Filter: Only the messages that match the criteria will be shown; other messages will not be displayed.
Messages in the Trace table can be dragged into either the Stop Filter or Pass Filter to form filtering conditions. Whether the filtering takes effect is determined by the Filter Group and whether the Stop Filter / Pass Filter entry is enabled; the checkboxes in front of the filtering items are used to select entries, mainly in conjunction with management operations such as full selection, unselecting full selection, and deleting selected items, and are not used as the enabling switch for a single filtering condition.
4.5 Activate / deactivate analysis filter
Button prompt: Activate / deactivate analysis filter
Used to enable or disable the analysis filtering rules.
- After enabling, the enabled "Filter Group" and the enabled "Stop Filter" / "Pass Filter" entries will be applied to the Trace table. The existing filtering items under the entry will be processed as a whole and there is no need to check each one individually.
- After deactivation, the filtering configuration remains but does not affect the display of the Trace table.
When the filtering function is disabled, a prompt reading "Filter is deactivated" will be displayed at the top of the filtering panel.
4.6 Jump to Timestamp
Input field name: Jump to Timestamp:
Used to jump to the specified Trace position by time. The input unit is in seconds and supports 6 decimal places.
Usage Restrictions: This function is usually enabled in the "Paused State" and "Expanded Mode". After entering the time value, Trace will jump to the first visible message whose timestamp is greater than or equal to this value; if no matching message is found, it will jump to the last message.
4.7 Clear Trace
Button prompt: Clear Trace
It is used to clear the current Trace window content and restart the display of Trace data. After clearing, the historical records in the current table will be removed.
Applicable scenarios: To start a new analysis, or to clear irrelevant historical data.
4.8 Pause/Resume Update
Button prompt: Pause/Resume Update
Used to pause or resume the refreshing of the Trace table.
- After the pause, the current displayed content remains unchanged, facilitating search, filtering, copying, viewing signal details and jumping to the corresponding time.
- After the restoration, Trace continued to follow the real-time data updates.
When you scroll or drag the scroll bar of the Trace table upwards, the system may automatically enter a pause state to allow users to view historical data. The "Pause" / "Resume" option in the right-click menu functions in the same way as this button.
4.9 Toggle time mode
Button prompt: Toggle time mode
Used to switch the display mode of the "Time" column:
- Absolute Time: Displays the message timestamp.
- Delta Time: Displays the time difference between the current message and the previous visible message.
When using filtering conditions, the Delta time will be recalculated based on the currently visible messages, facilitating the analysis of the time intervals between adjacent messages in the filtering results.
4.10 Toggle display mode
Button prompt: Toggle display mode
Used to switch the display mode of Trace:
- Group Mode: Default mode. It displays identical or related messages in groups, which is suitable for observing the latest status and counts of the messages.
- Expanded Mode: Expanded Mode, displays each message in chronological order, suitable for tracing back and locating specific events.
When you need to use "Jump to Timestamp" or analyze historical messages one by one, it is recommended to switch to the Expanded Mode and pause the Trace.
4.11 Filter Items for Diagnostics
Button prompt: Filter Items for Diagnostics
This is used to filter Trace data by diagnostic-related items. This button is only available when the diagnostic module provides filterable items; when it is unavailable, the button will display the "Disabled" prompt.
Applicable scenario: Quickly review the requests, responses or associated messages related to the current diagnostic operation from a large amount of Trace data.
4.12 Protocol Selection Dropdown Box
The top dropdown box is used to select the type of data protocol currently displayed:
CAN_LINEthernetSYS
After the switch, the Trace table will refresh and display the content according to the selected protocol. The visible columns will vary depending on the protocol. For example, CAN FD-related columns are only displayed under the CAN_LIN type, Ethernet shows source IP, destination IP, and other network fields, while SYS shows variable name, namespace, type, and value.
4.13 Protocol Display Examples
The CAN_LIN view is mainly used to view CAN, CAN FD, and LIN messages. Common columns include channel, ID, event type, direction, data length, and data bytes.
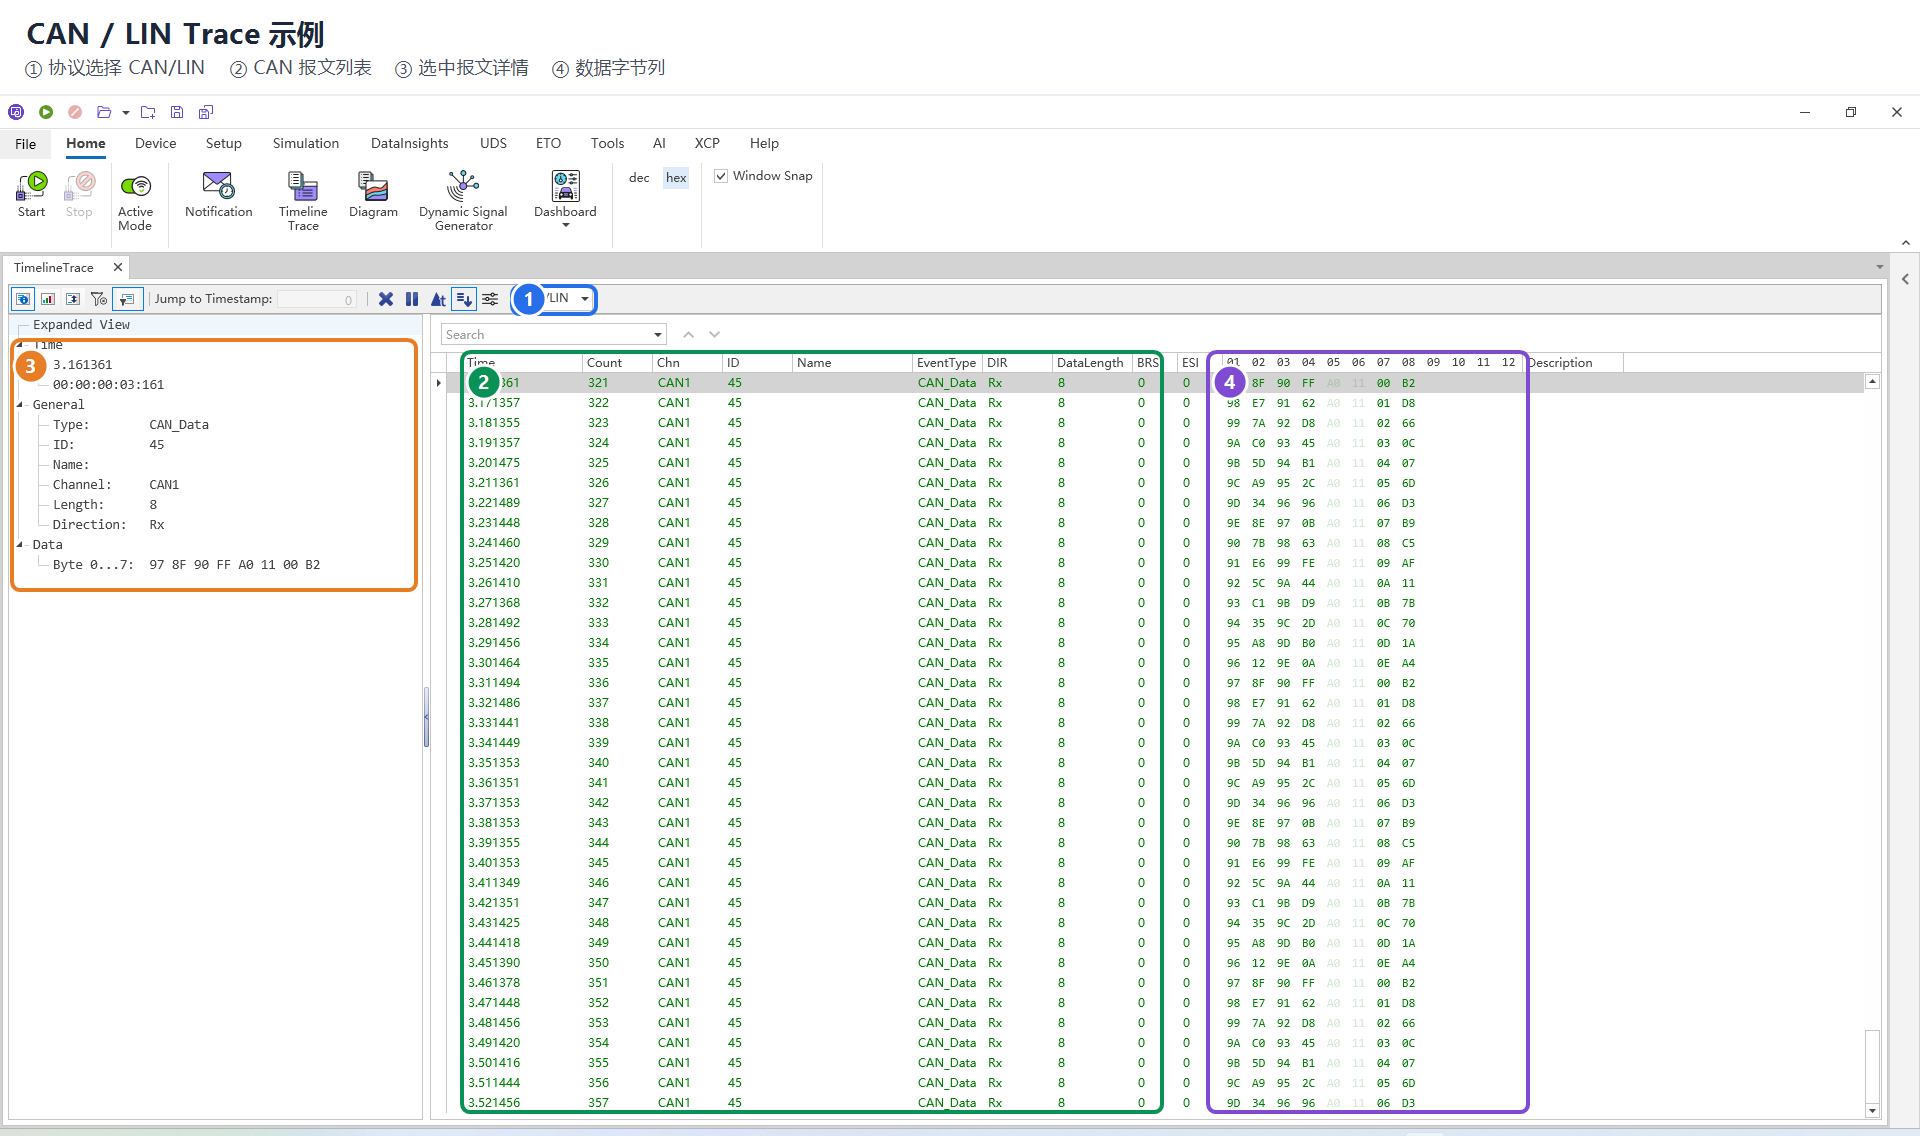
Figure 6: CAN / LIN Trace Example. After switching to CAN/LIN, you can view the list of CAN messages and the detailed data of the selected message.
The Ethernet view is mainly used to view Ethernet-related events. Common event types include ETH_DATA, UDP_Data, RTPS_Data, etc. The table shows channel, event type, direction, data length, data bytes, source IP, and destination IP.
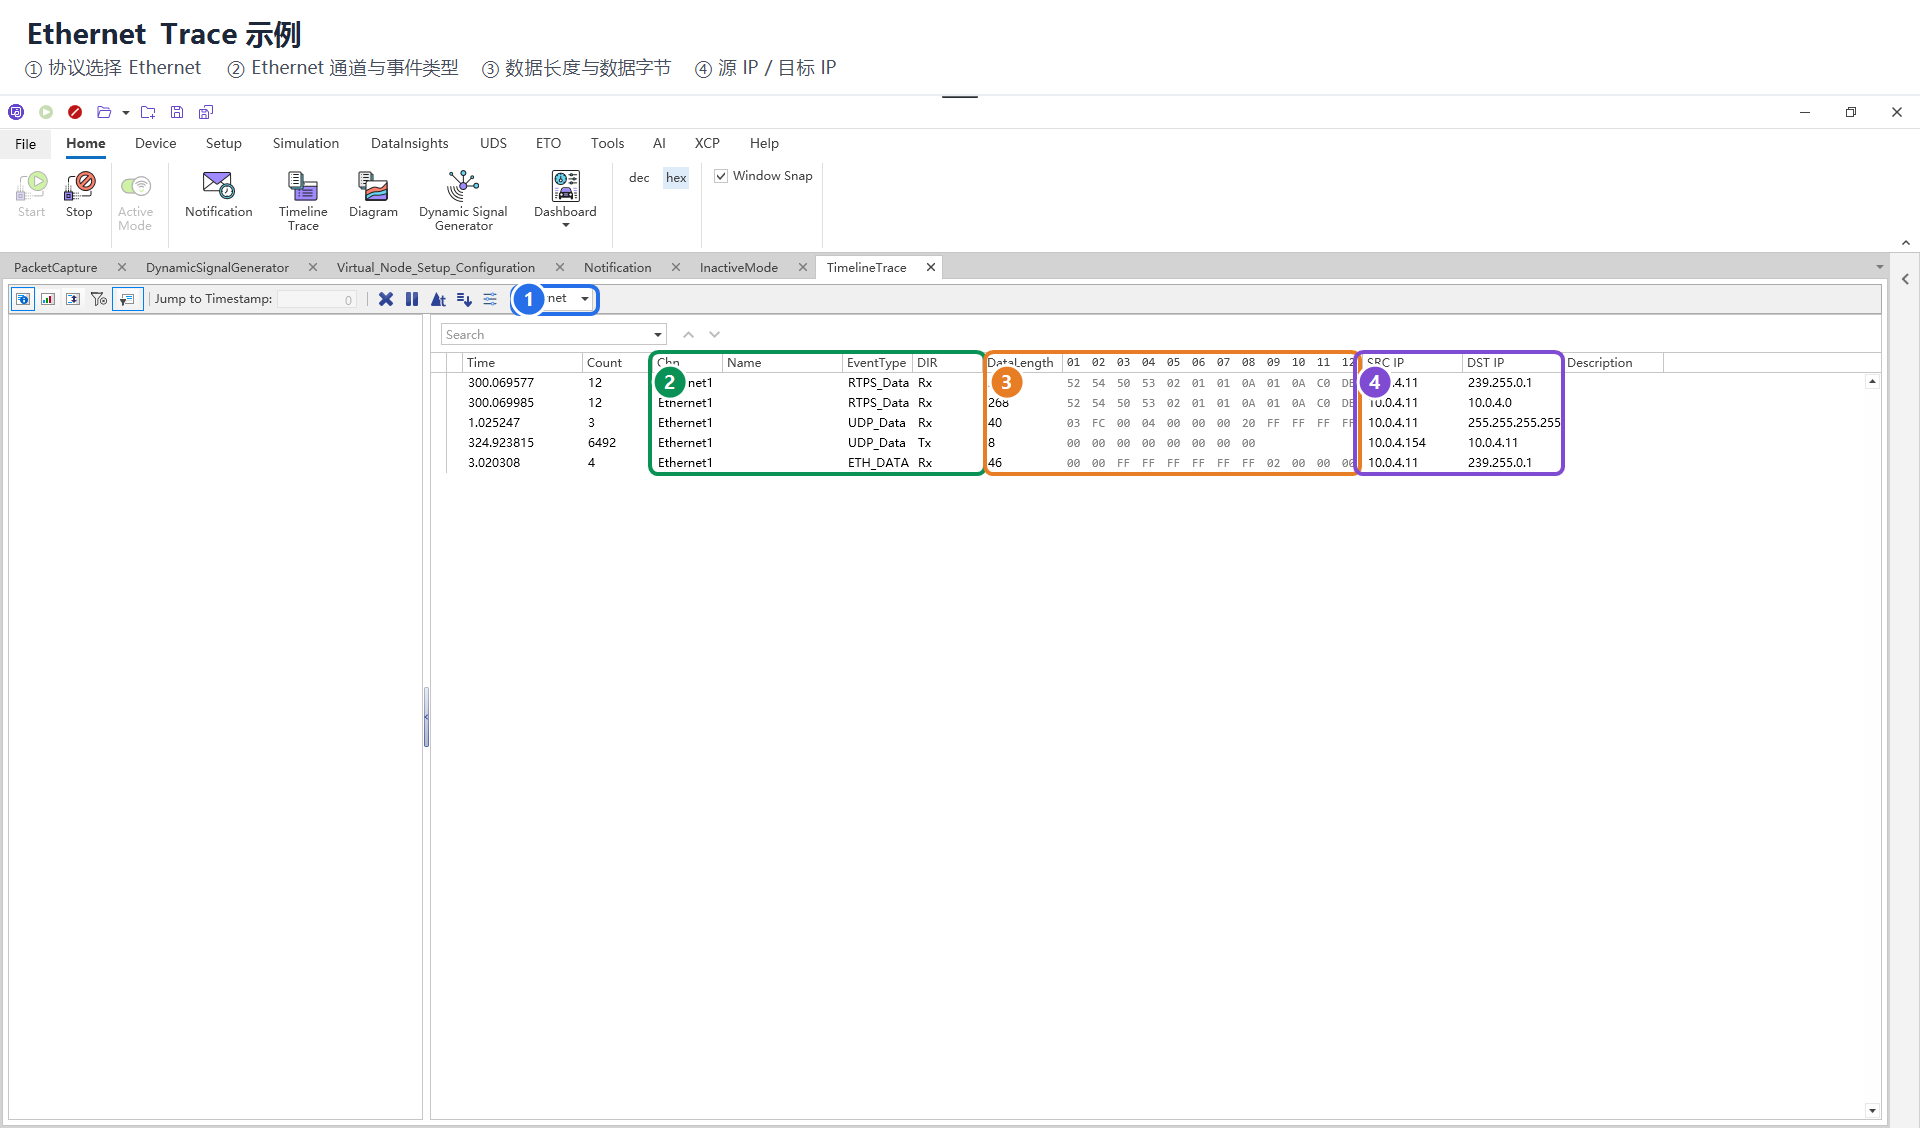
Figure 7: Ethernet Trace Example. After switching to Ethernet, you can view the Ethernet channel, event type, data content, and IP information.
The SYS view is mainly used to view system variables or system events. It is not a regular bus message sending result, and is usually generated by variable writes, variable changes, or related playback. The table shows variable name, namespace, symbol type, value type, and value.
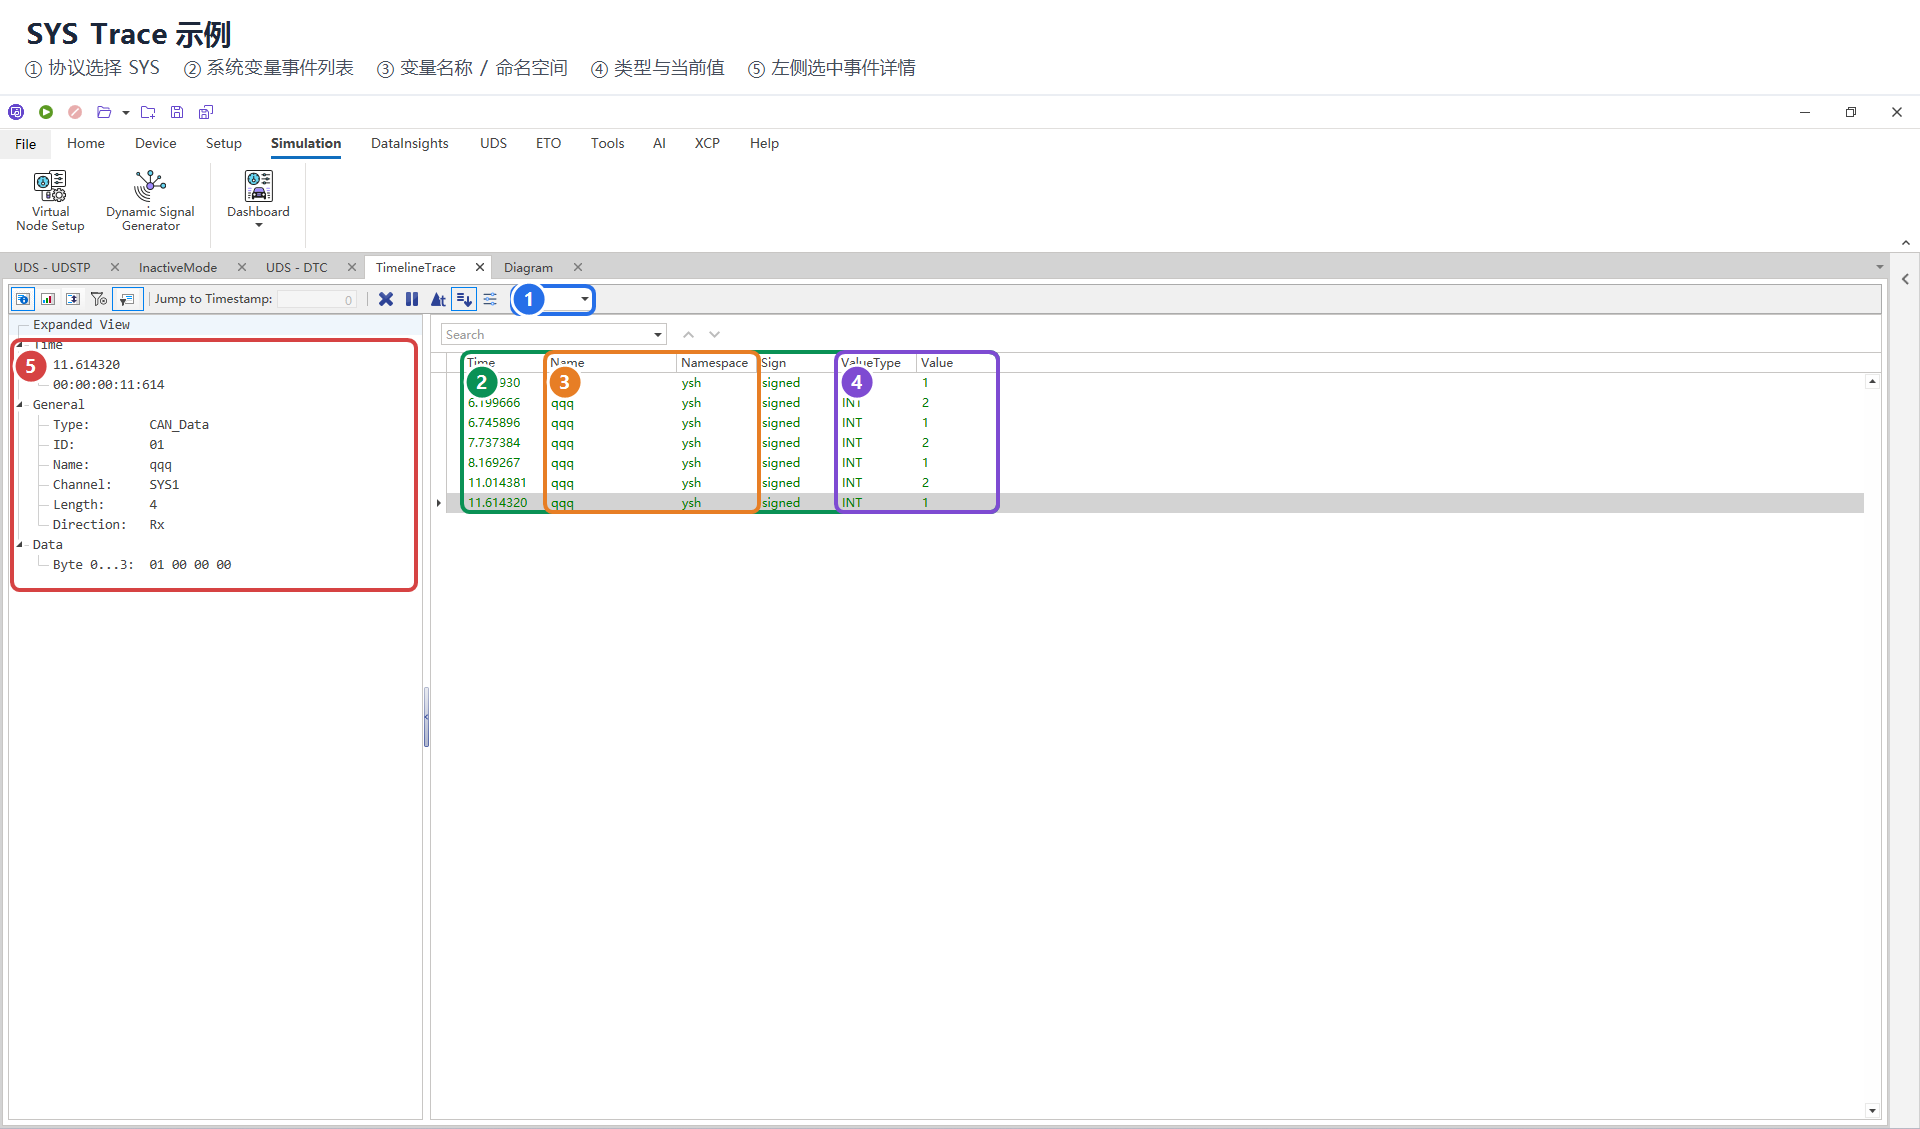
Figure 8: SYS Trace Example. After switching to SYS, you can view system variable events and the details of the selected event.
5. Trace table operation
5.1 Select the message
The Trace table supports single selection and multiple selection. After a message is selected, the Expanded View, Analytics view, and Delta View on the left side will refresh the content based on the current selection.
- Single choice: Click directly on a specific line of the message.
- Continuous multiple selection: First click on the starting message, hold down the
Shiftkey, then click on the ending message. Messages within the middle range will be selected together. - Discrete multiple selection: Hold down the
Ctrlkey and click on each message that needs to be analyzed one by one. You can select multiple non-adjacent messages.
When using the "Analytics view", if only one message is selected, the time interval cannot be calculated; if multiple messages are selected, it will calculate the message interval as well as the minimum, maximum and average values of the interpretable signals.
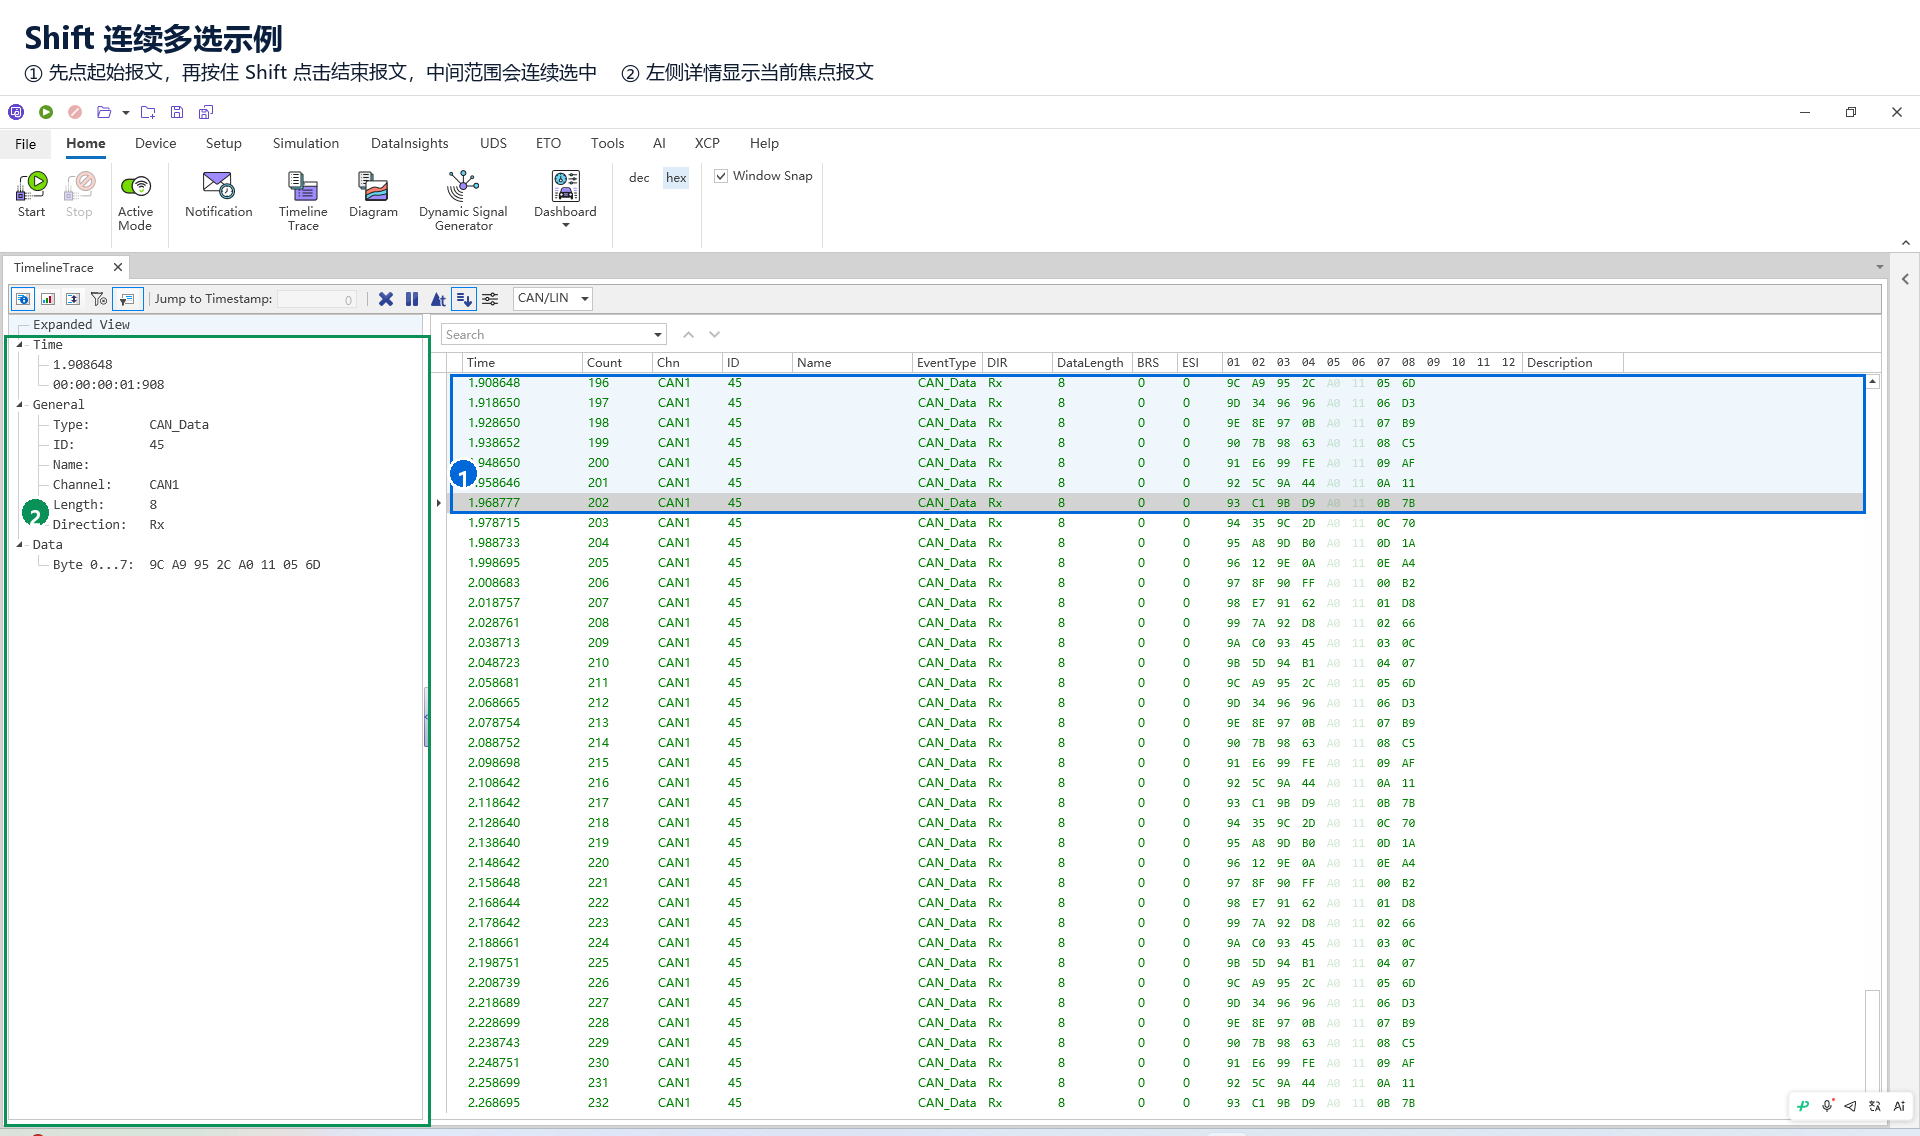
Figure 3: Holding down the Shift key allows for continuous selection of a segment of the message.
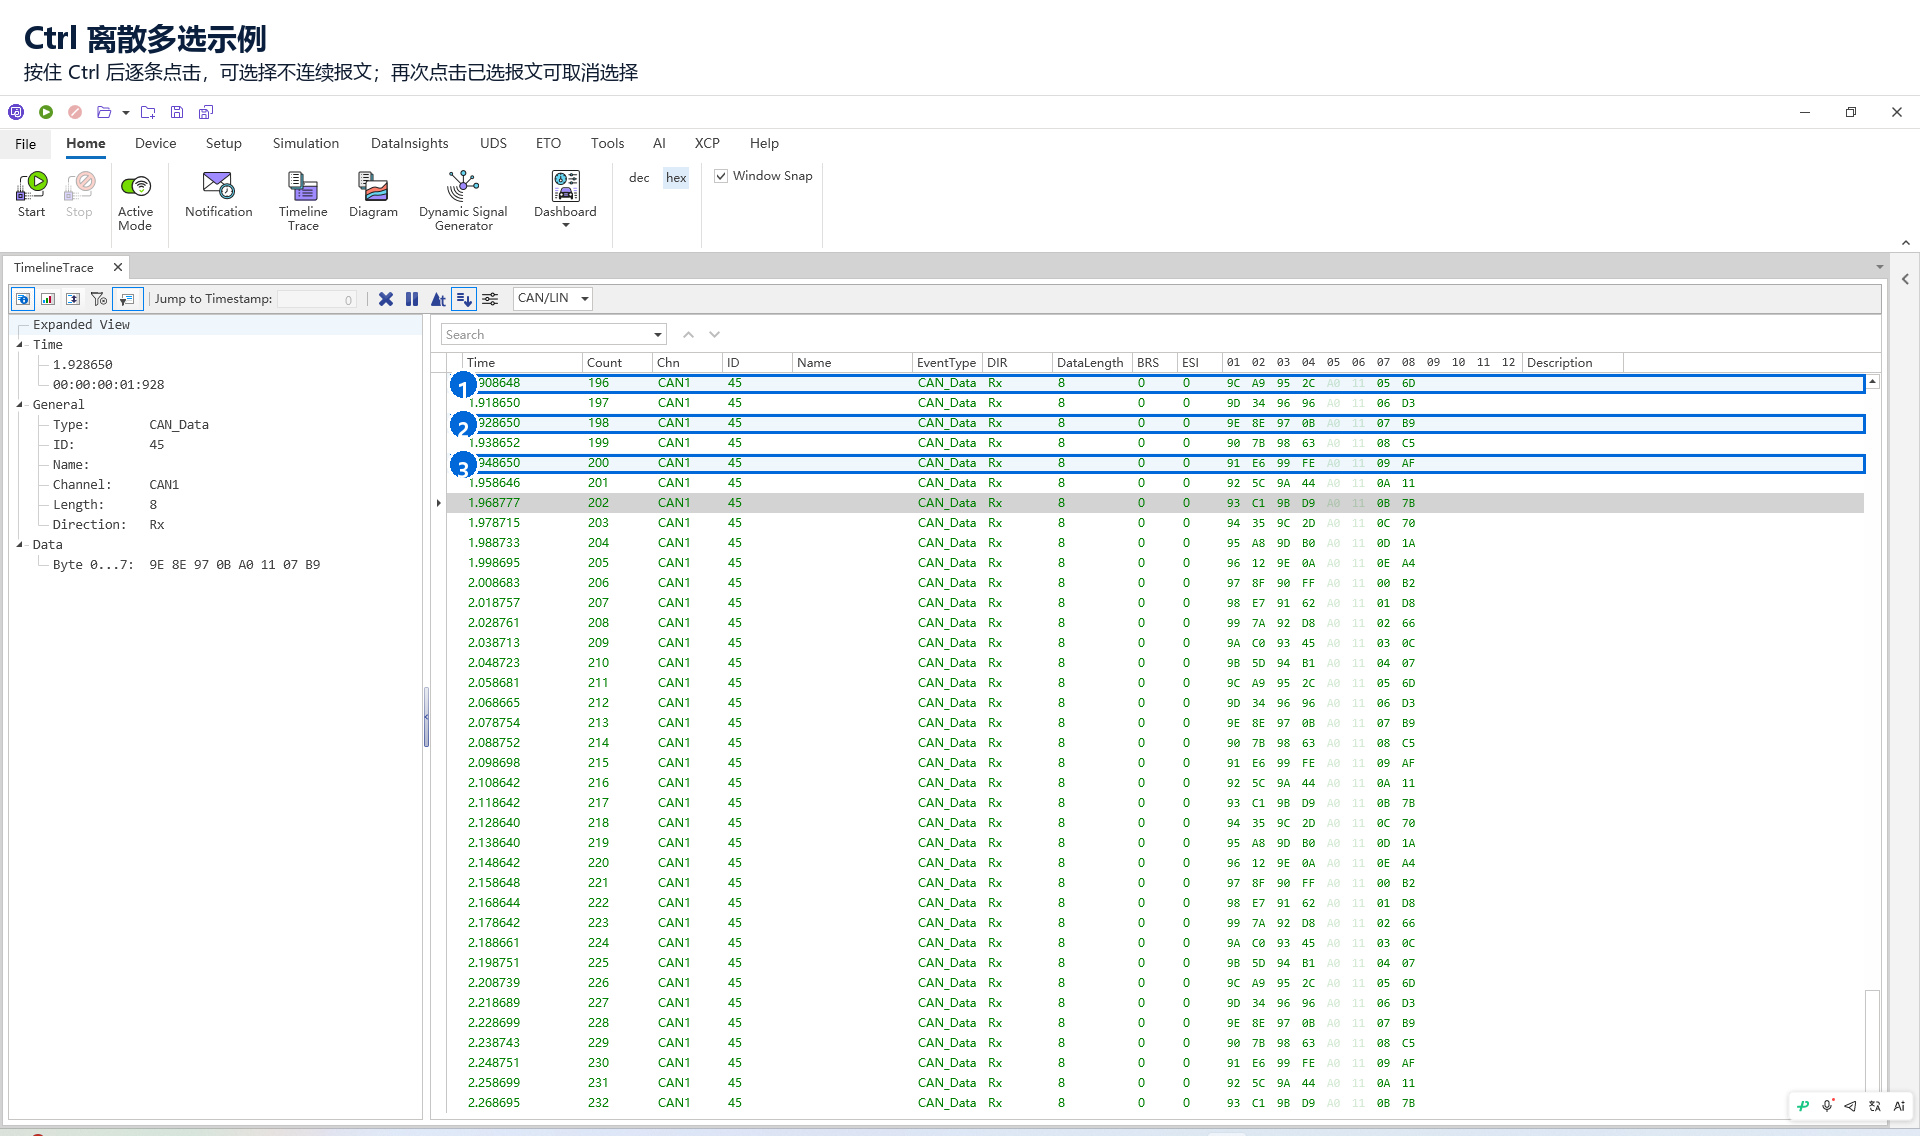
Figure 4: Pressing the Ctrl key allows selection of multiple disconnected messages.
5.2 Search
The top of the Trace table features a search box. After entering a keyword, the table will highlight the matching results and provide navigation buttons for the results. The search does not alter the original data; it is merely used for quickly locating the visible content.
5.3 Column Filtering
Some columns support column filtering, such as Chn, ID, Name, EventType, DataLength, etc. After clicking the filter entry of the column header, you can filter the Trace data by field values.
Common filtering methods:
- Filter by channel: Only view the messages of a specific Channel.
- Filter by ID: Only view the specified message ID.
- Filter by name: View the specific symbol names of the database.
- Filter by event type: Differentiate between normal frames, error frames or system events.
5.4 Expand the details of the signal
When the message contains interpretable signals, a detail expansion button will appear at the beginning of the line. After expanding, you can view the list of signals under this message, including the signal name, value, original value and description.
5.5 Copy
Right-clicking in the Trace table allows you to use:
Copy: Copy the currently selected content.Copy All: Copy the current table content.
The copied content usually includes the header, which makes it easy to paste into a text, table or issue record.
5.6 Import and Export
Right-click in the Trace table and select Import/Export:
Import...:Import.ascor.blfoffline log files.Export All...:Export all Trace contents.Export Selected...:Export the current selected Trace content.
You can also drag a single .asc or .blf file into the Trace table area to import it. If multiple files are dragged in or the file format is not supported, the system will prompt you to re-select.
6. Data Filter operation
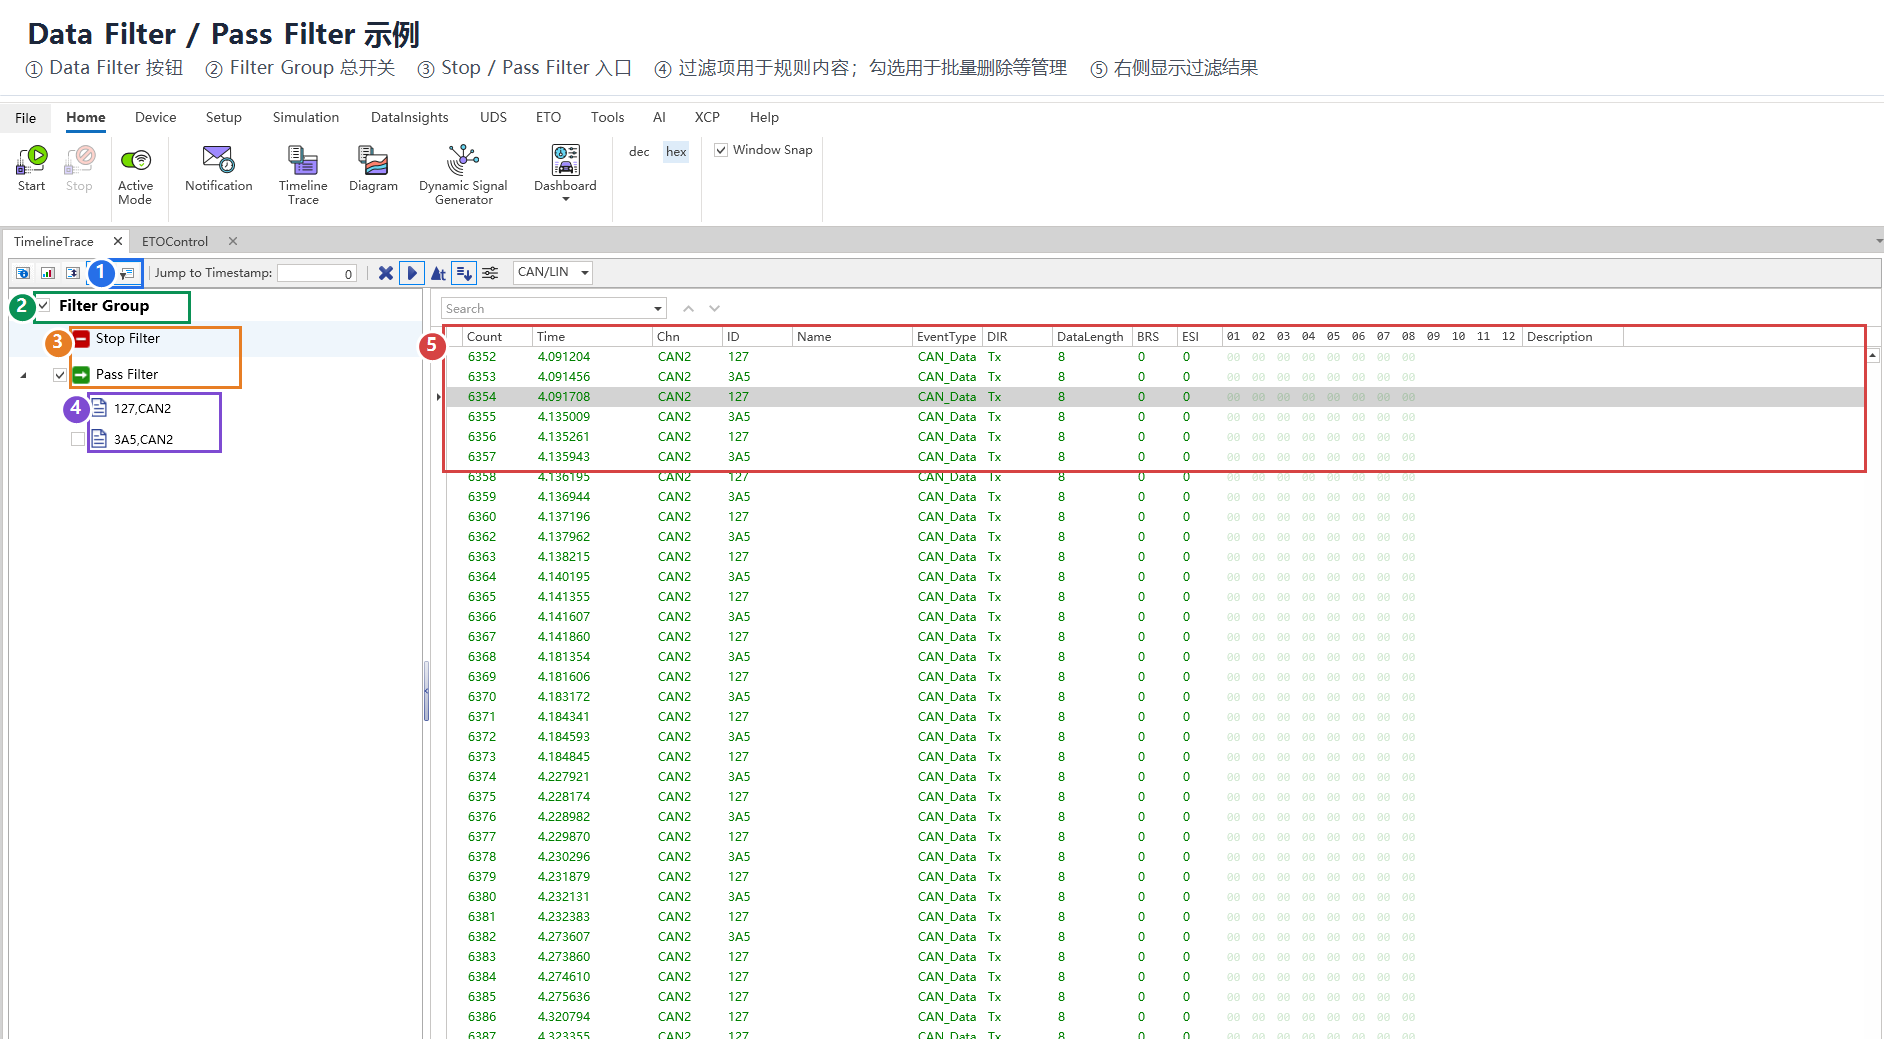
Figure 5: Data Filter Example. Whether the filtering takes effect is determined by the Filter Group and the Stop Filter / Pass Filter buttons; the checkboxes preceding the filtering items are mainly used for management operations such as batch deletion.
6.1 Add filtering criteria
- Open the "Data Filter" panel.
- In the Trace table, select the messages that need to be added with filtering rules. You can select a single message or multiple messages and then drag them together.
- Drag the message to either "Stop Filter" or "Pass Filter".
- Make sure that the
Filter Groupand the correspondingStop Filter/Pass Filterentries are enabled. - Click on
Activate / deactivate analysis filterto enable the filter.
6.2 The difference between Stop Filter and Pass Filter
Stop Filter is suitable for filtering out noise messages. For instance, if there are too many messages in a certain period, you can add it to the "Stop Filter", and then this message will no longer be displayed in the Trace.
Pass Filter It is suitable for scenarios where only a few target messages need to be focused on. For instance, if you only want to view the interaction process of certain IDs, you can add these messages to the "Pass Filter" and "Trace" settings, and only display the matching items.
6.3 Manage filter items
Right-click on the filter entry or filter item in the filter panel to execute:
Select All Items/Select All:Select the filtering items to facilitate subsequent batch deletion.Deselect All Items/Deselect All:Unselect the selected items of the filter.Delete Selected Items/Delete Selected:Delete the currently selected filtering item.Delete:Delete the current filter item.
Note: The "selected/unselected" here refers to the management status of filtering items, mainly used for batch deletion. It does not determine whether the filtering item participates in the filtering process. As long as the Filter Group and the Stop Filter / Pass Filter entry are enabled, the filtering items under the entry will participate in the filtering as rules.
The filtering configuration will be saved and loaded along with the engineering configuration. When switching between engineering projects, if the current project does not have a filtering configuration, Trace will reset the filtering rules to avoid continuing the filtering state from the previous project.
7. Recommended operation procedure
7.1 View the message in real time
- Open the project and configure the hardware, database and measurement environment.
- Open
Timeline Trace. - Start the measurement.
- Choose
CAN_LIN,EthernetorSYSas per the requirement. - Use the search box, column filtering or Data Filter to locate the target data.
- If you need to review carefully, click "Pause/Resume Update" to pause the refresh process.
7.2 Analyze the message with the specified ID
- Filter the target ID in the Trace table by using the
IDcolumn. - Click on
Toggle time modeto switch to Delta time and view the message intervals. - Click on
Expanded Viewto view the detailed signal analysis of a single message. - If you wish to keep a long-term watch on this ID, please drag this message into the "Pass Filter" and enable the analysis filter.
7.3 Offline analysis of log files
- Open the Trace window.
- Right-click in the table area, then select
Import/Export->Import...`。 - Select either
.ascor.blffiles. - After importing, use functions such as search, column filtering, Data Filter, and Delta Time to analyze the logs.
- When you need to output the results, right-click and select "Export All..." or "Export Selected..." `。
7.4 Locate the problem by time
- Click on
Pause/Resume Updateto pause the Trace. - Click on
Toggle display modeto switch to Expanded Mode. - In the
Jump to Timestampsection, enter the target time, for example,12.345678. - After Tracing jumps to the vicinity of the target time, it continues to analyze based on the surrounding context messages.
8. Common Precautions
- If Trace keeps scrolling, it will be inconvenient to view the historical data. So, pause the refresh process before making any operation.
Jump to Timestampis only available under certain conditions. Usually, it requires pausing and being in the "Expanded Mode".- Group Mode is more suitable for viewing the latest status and count of messages, while Expanded Mode is better for tracking the chronological order of each message.
- In Data Filter, merely configuring the rules does not necessarily mean they will take effect. It is necessary to confirm that the
Filter Group, the correspondingStop Filter/Pass Filterentry have been enabled, and that the analysis filtering has also been enabled. The checkbox in front of the filtering items is for managing the selection status, not the switch for enabling the filtering. - When using both Pass Filter and Stop Filter simultaneously, it is important to pay attention to the rule combination to avoid including the target message in both the exclusion and pass conditions.
- When importing offline files, it is recommended to import only one
.ascor.blffile at a time. - When viewing the Delta time in the filtering results, the time difference is calculated based on the currently visible messages and may not be equivalent to the time difference between adjacent messages before filtering.