Graphics
-
Graphics Overview:
Graphics is a visual tool to show received data from CAN, LIN and system variables. User can analysis and save the received data via Graphics features, such as ZOOM, Measurement, print and export, etc. Graphics features are included in BarMenu and SelectMenu and you must right click the blank area on left panel to show SelectMenu. See as Figure 1-1.
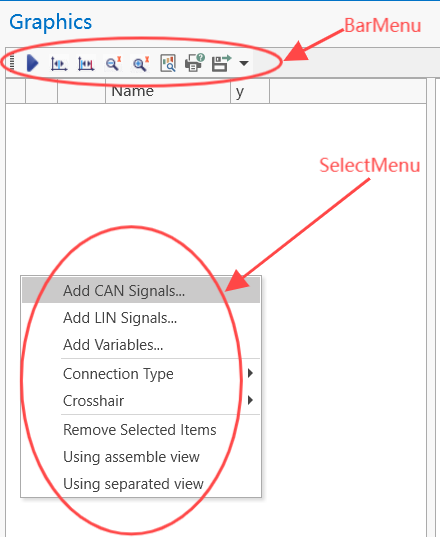
Figure 1-1
Using Graphics
-
Startup Graphics visual System
Open OAK ETStudio, select
Analysis -> Graphics,then Graphics visual System will be opened, see as Figure 1-2.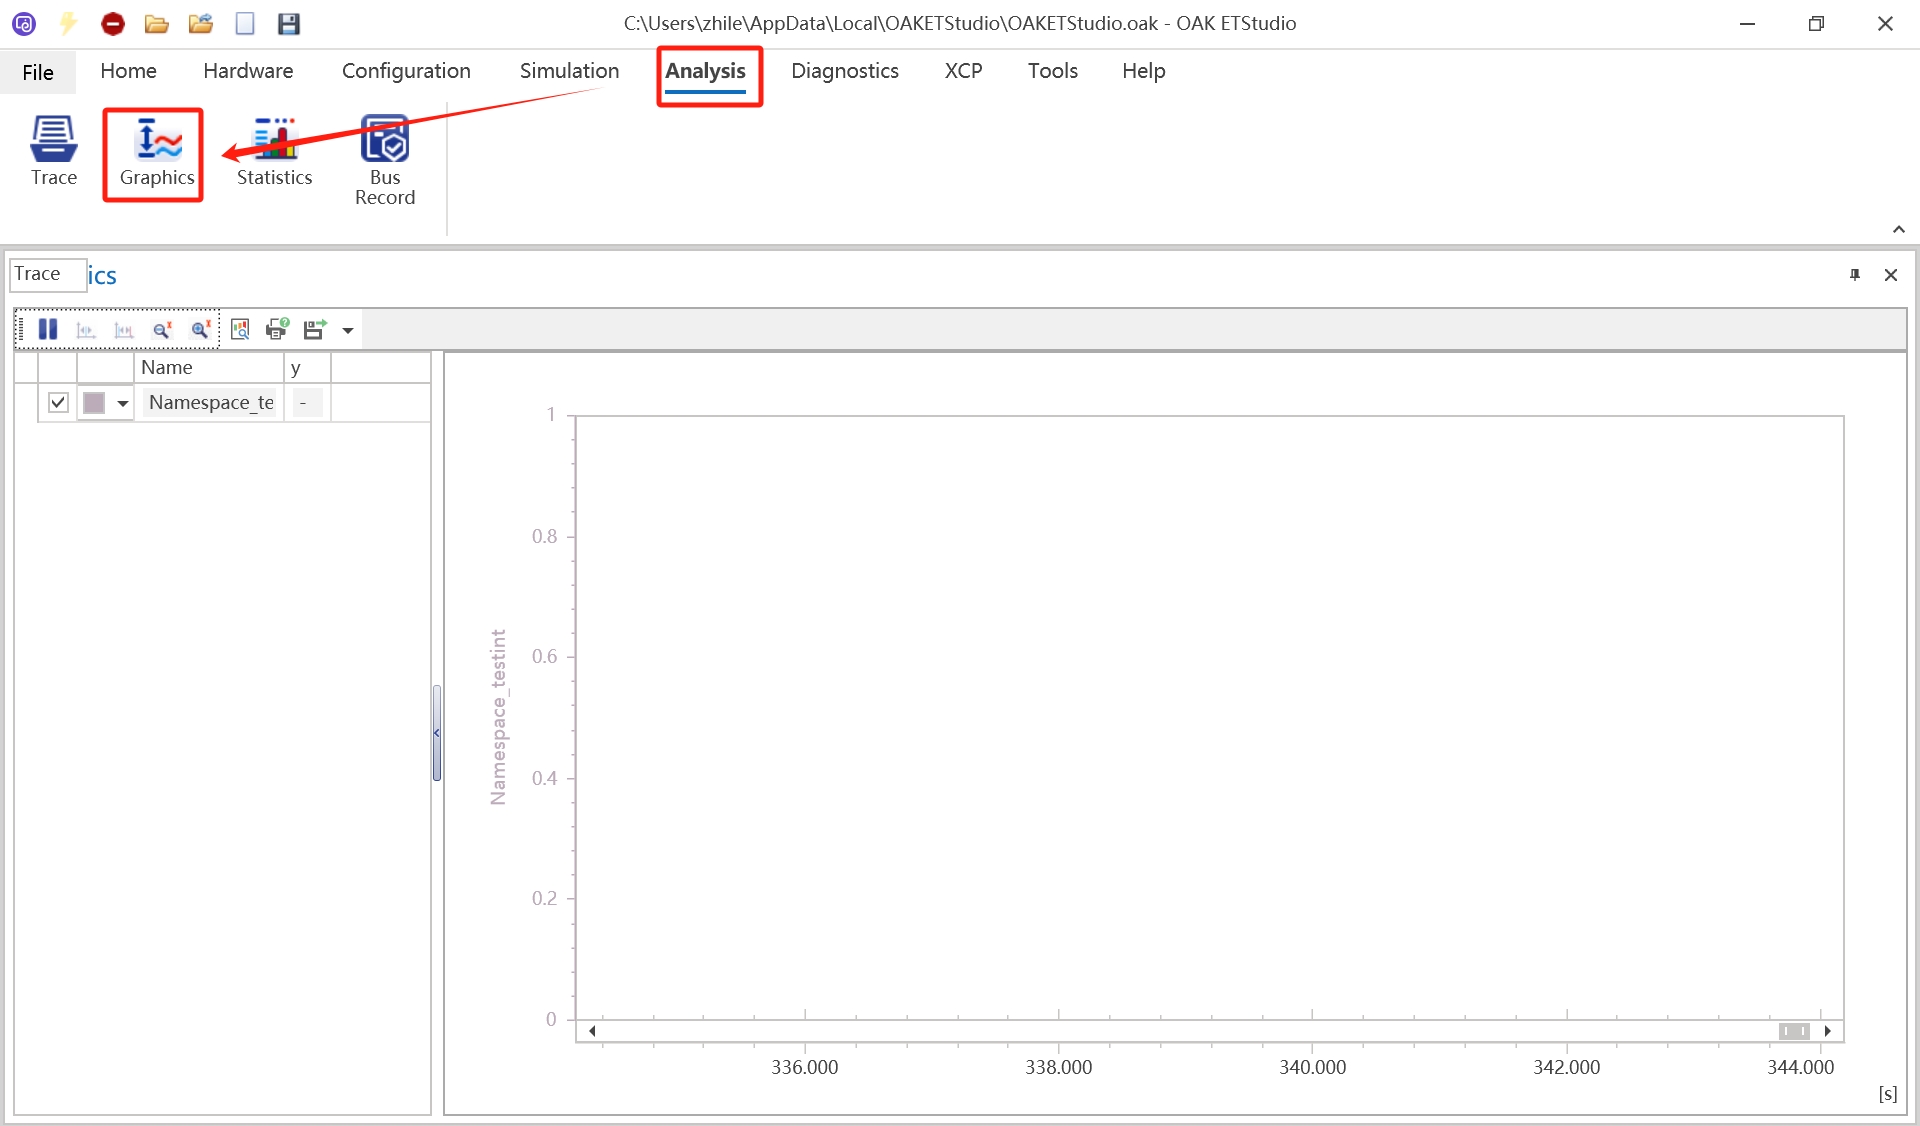
Figure 1-2
Menu
-
1. BarMenu overview
BarMenu provides features of start/stop, Measurement, Difference-measurement, Zoom-in, Zoom-out, Print, Print-Overview and Export, See as Figure 1-3.
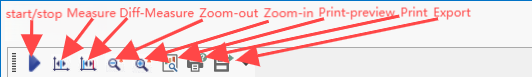
Figure 1-3
1-1. Start-Stop Graphics.
Click Stop button to pause Graphics data refreshing and click start button to continue Graphics data refreshing, see as Figure 1-4 and Figure 1-5


Figure 1-4 Figure 1-5
1-2.
Measurement.Not implement yet.
1-3. Difference Measurement.
Prerequisite: Must pause refreshing Graphics data.
1-3-1: No signal selected Difference Measurement.
Click Difference-Measure button, then the blue constantLine and red constantLine will show, move any of the constantLine to the data point you want to measure, then move another one. The timestamp of the data point and the time interval you want to measure will display at bottom left of Graphics chart. When you move constantLine, it will snap to the neareast data ponits and show the values of the signals.See as Figure 1-6 and Figure 1-7.
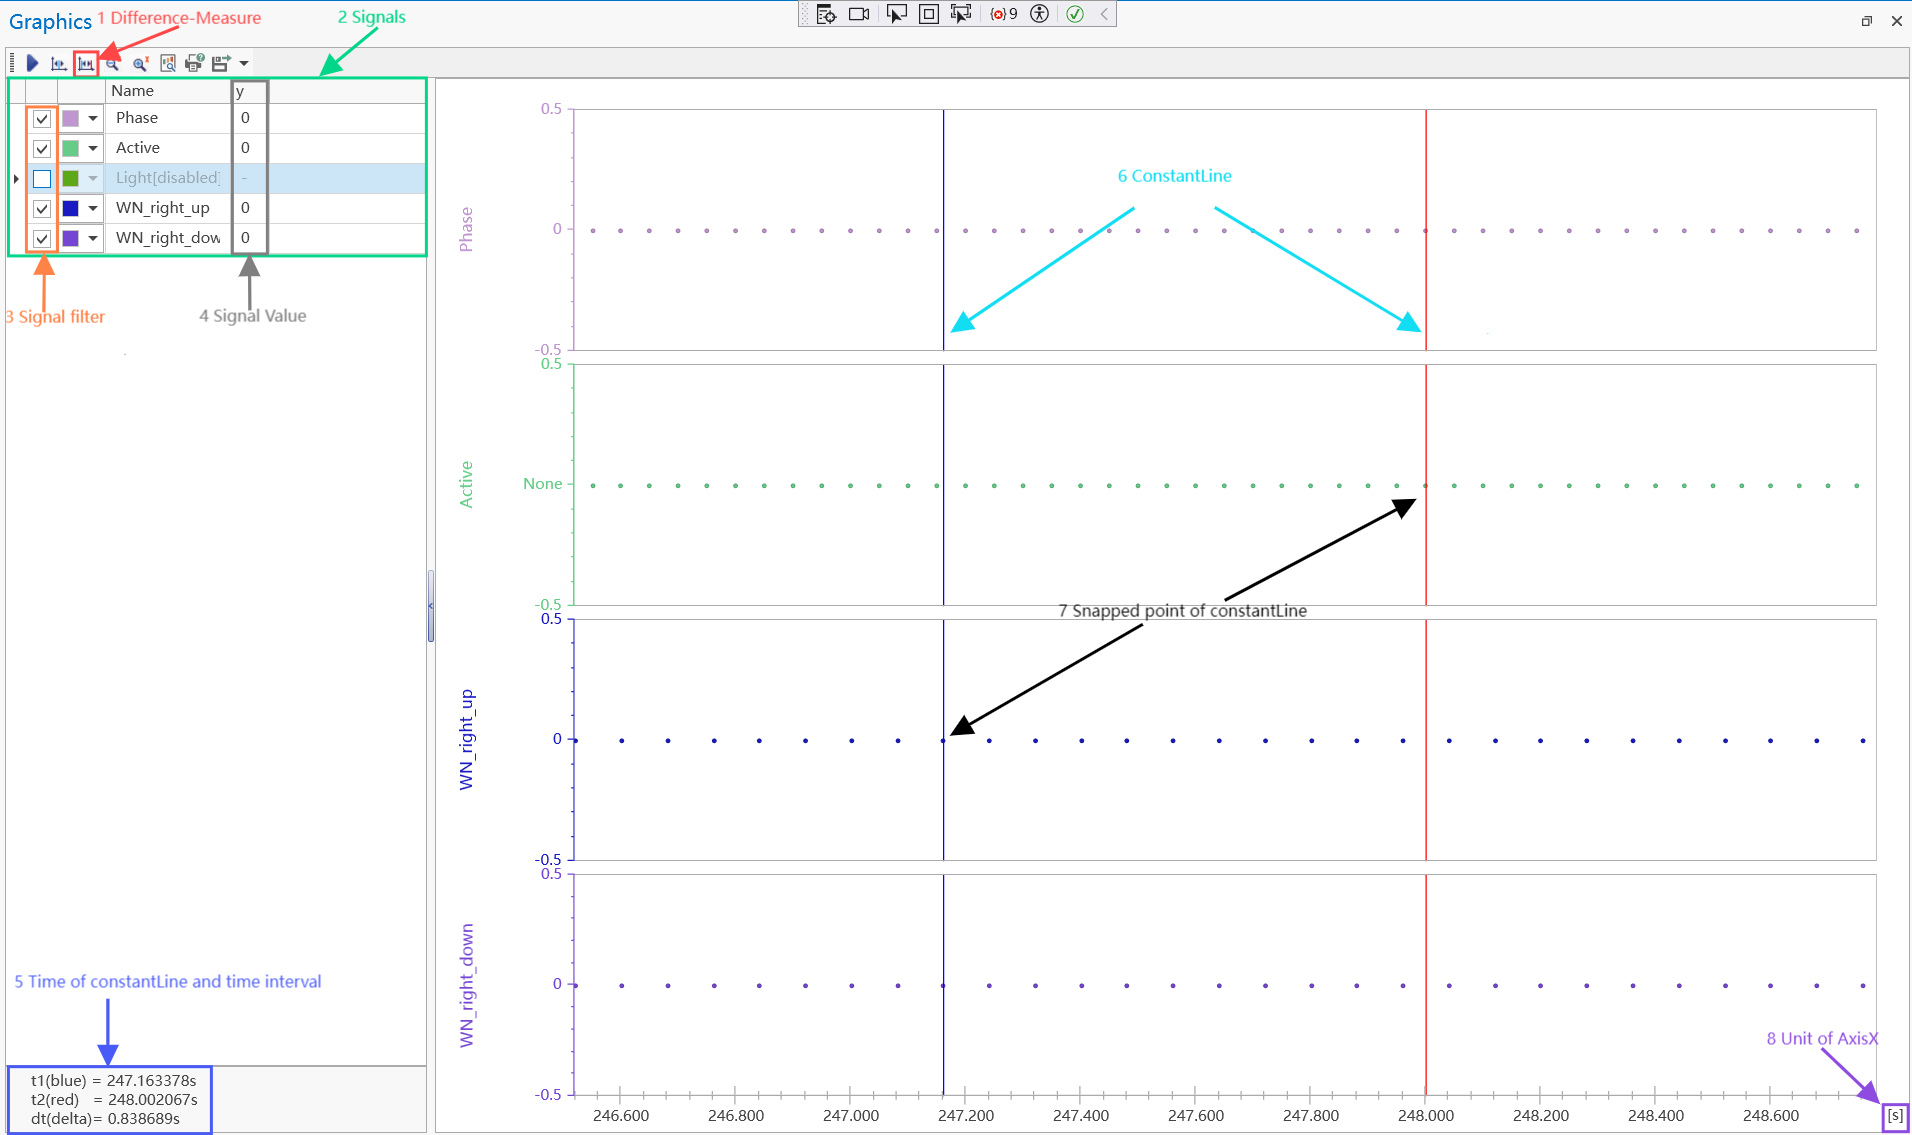
Figure 1-6
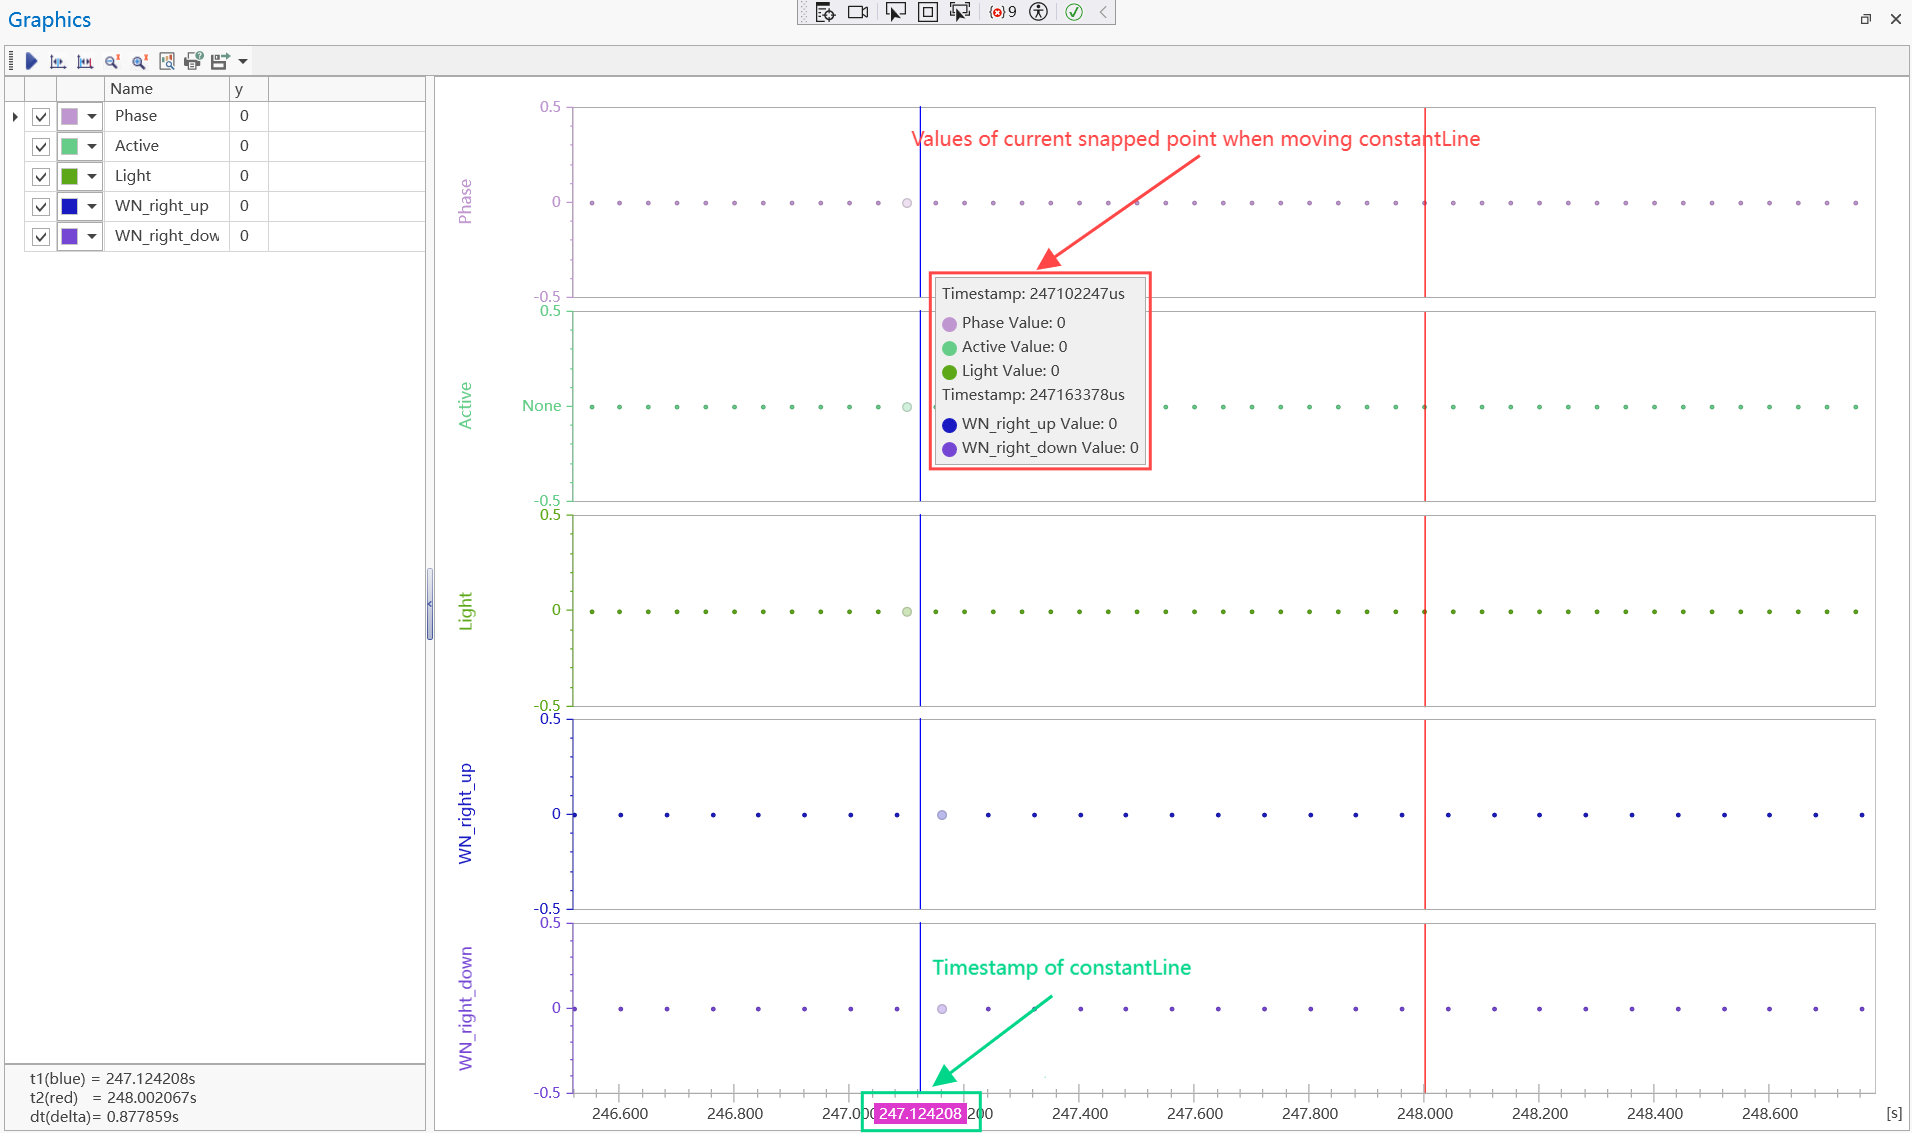
Figure 1-7
1-3-2: Difference Measurement with selectd signal selected.
Click the signal you want to measure on left panel in Graphics chart. Then choose Difference-Measure button, then the blue constantLine and red constantLine will show, move any of the constantLine to the data point you want to measure, then move another one. The timestamp of the data point and the time interval you want to measure will display at the bottom left of Graphics chart. When you move the constantLine, it will snap to the neareast data ponits in the selected signal and show the values of the signals. See as Figure 1-8.
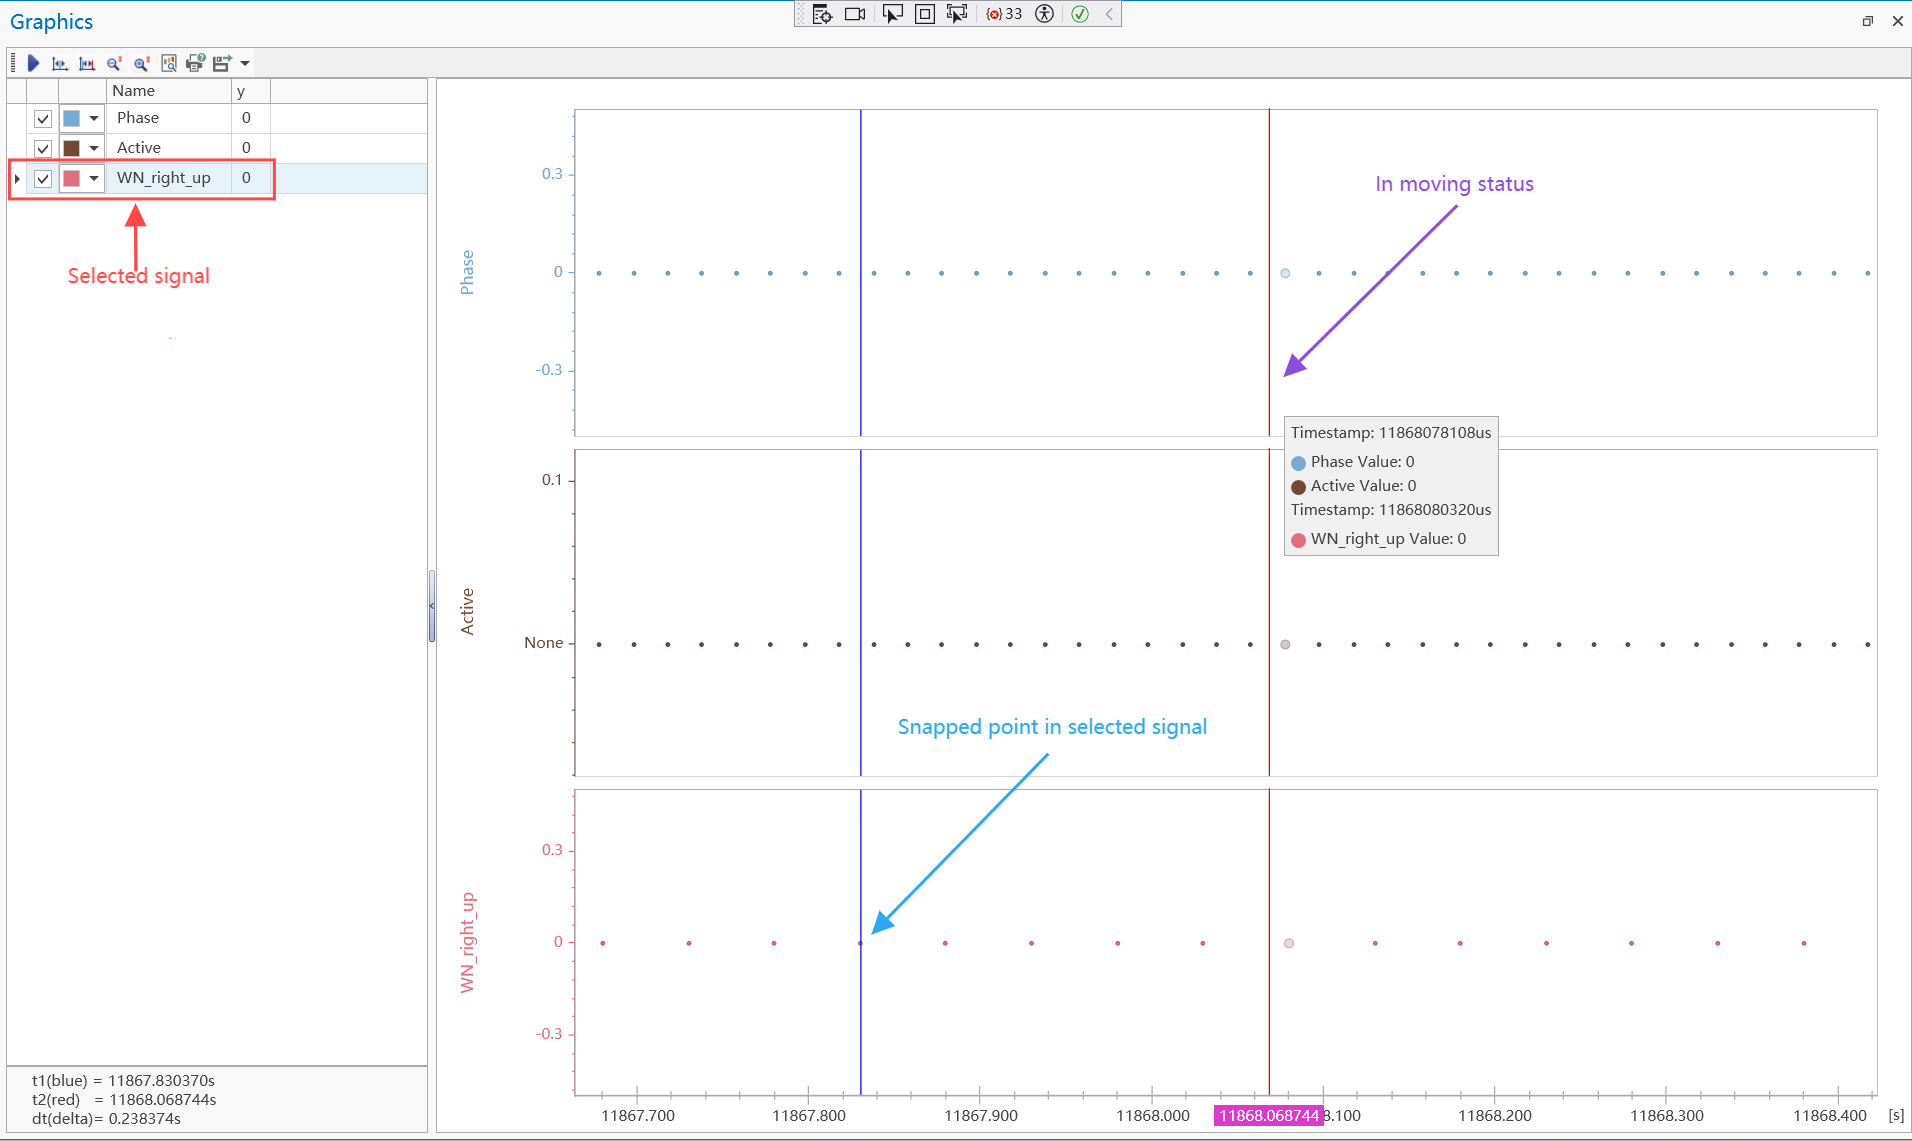
Figure 1-8
1-4: Zoom.
Prerequisite: Must pause Graphics data refreshing
1-4-1: Zoom-out
Move the mouse to the signal point, the axis or any where in the chart you want to zoom, then scroll the mousewheel backwards. Or use any of the following approaches.
1. Press Alt in the keyboard and then press the mouse left button down.
Note: Press Ctrl + Z to restore to previous status.
1-4-2: Zoom-in
Move the mouse to the signal point, the axis or any where in the chart you want to zoom, then scroll the mousewheel forwards. Or use any of the following approaches.
1. Press Shift in the keyboard and then press the mouse left button down.
2. Press Shift in the keyboard, then press the mouse left button down and move the mouse, finally a rectangle will be created int the chart. Then release the mouse.
Note: Press Ctrl + Z to restore to previous status.
1-5: Print-Preview:
Print-Preview provides the ability of previewing current chart, user can also print or save the previewed picture.See as Figure 1-9.
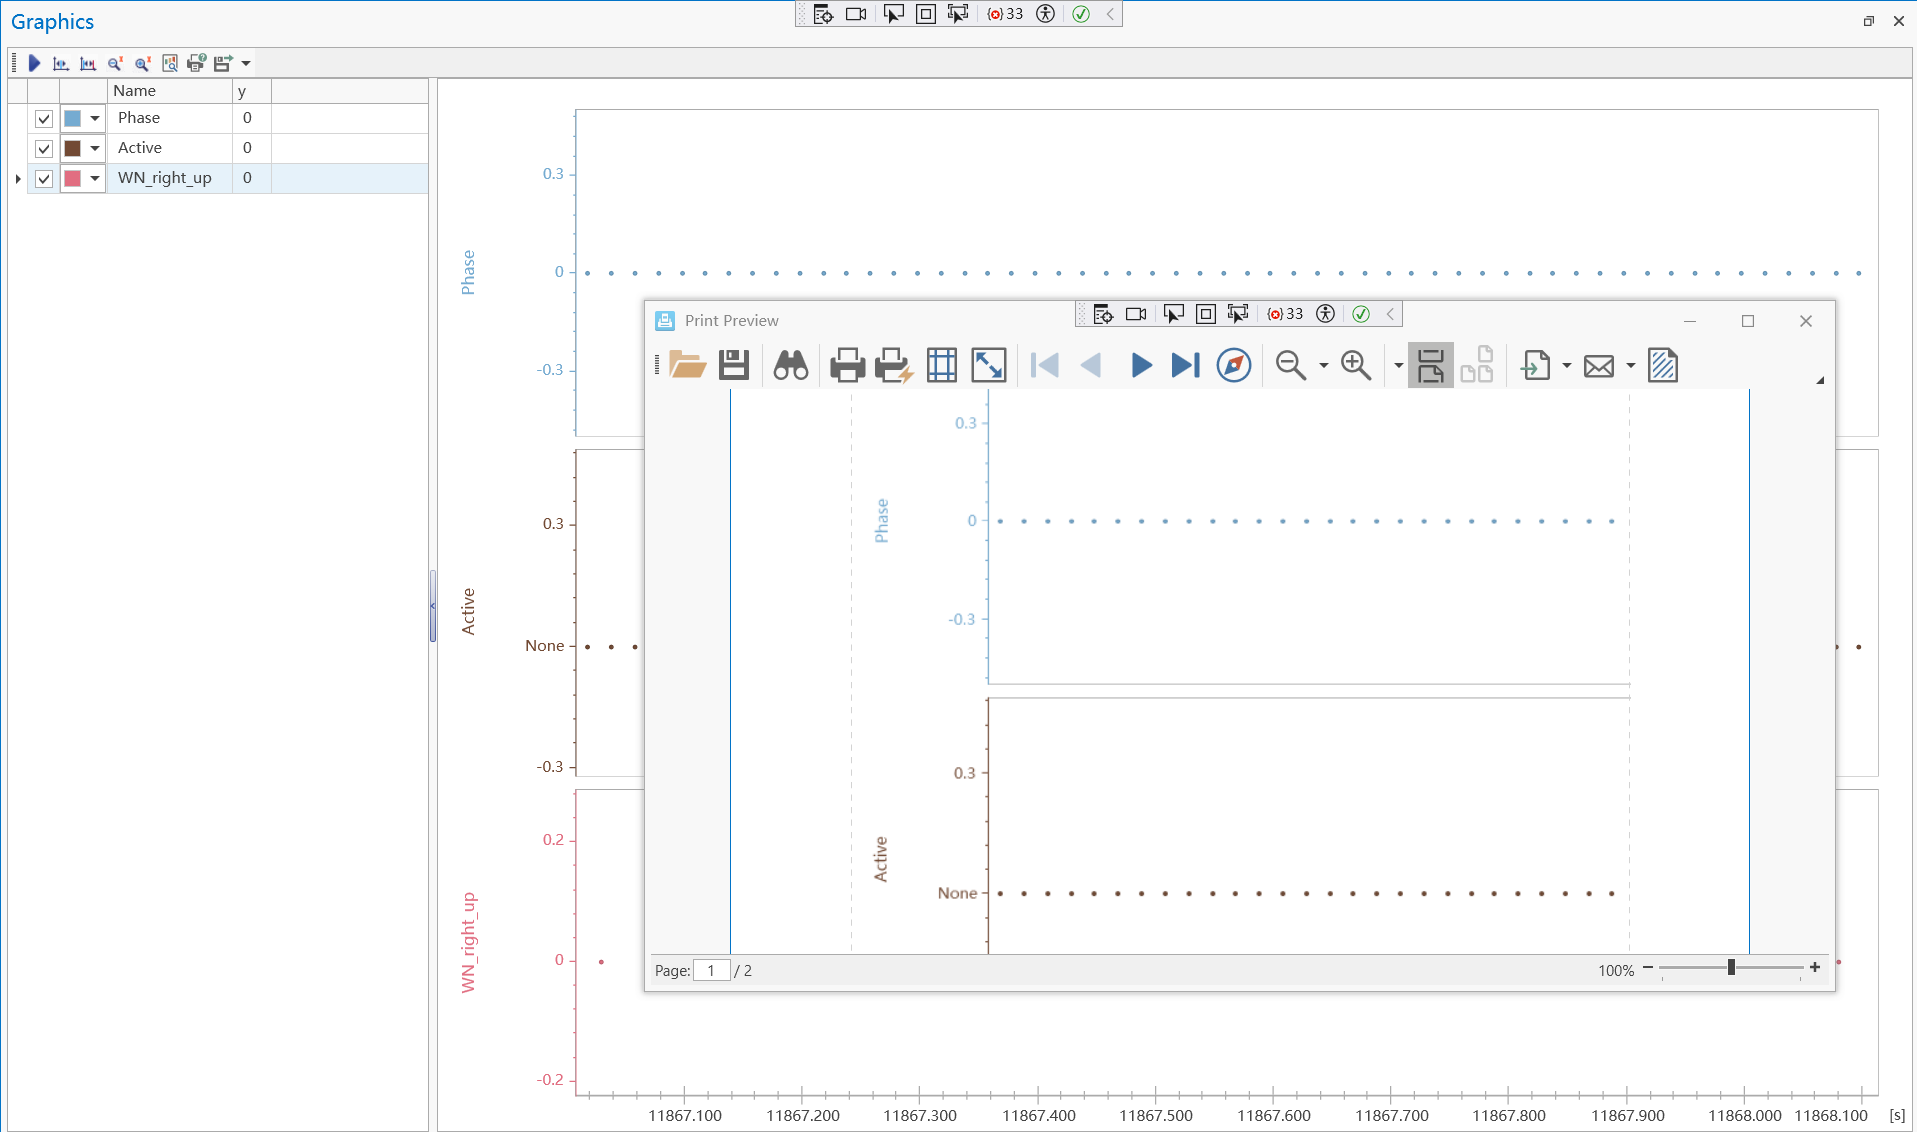
Figure 1-9
1-6: Print:
Print current chart, user can select the print style.
1-7: Export:
Export current chart to a selected file type. Supported file type are PDF, HTML, MHT, XLS, XLSX, RTF, DOCX and Image.
-
2. SelectMenu overview
SelectMenu includes Add CAN Signals, Add LIN Signals, Add Variables, Signal Style, Crosshair, Remove Selected Items, Using Assemble View and Using Separated View.
2-1: Add CAN signals:
Click any blank point of left panel with mouse right button in Graphics chart, then select
Add CAN Signalsin the popup menu. A dialog window will be opened, then choose the signals you want to observe and clickOKbutton. Finally the selected signals will be added in Graphics chart left panel. See as Figure 1-10.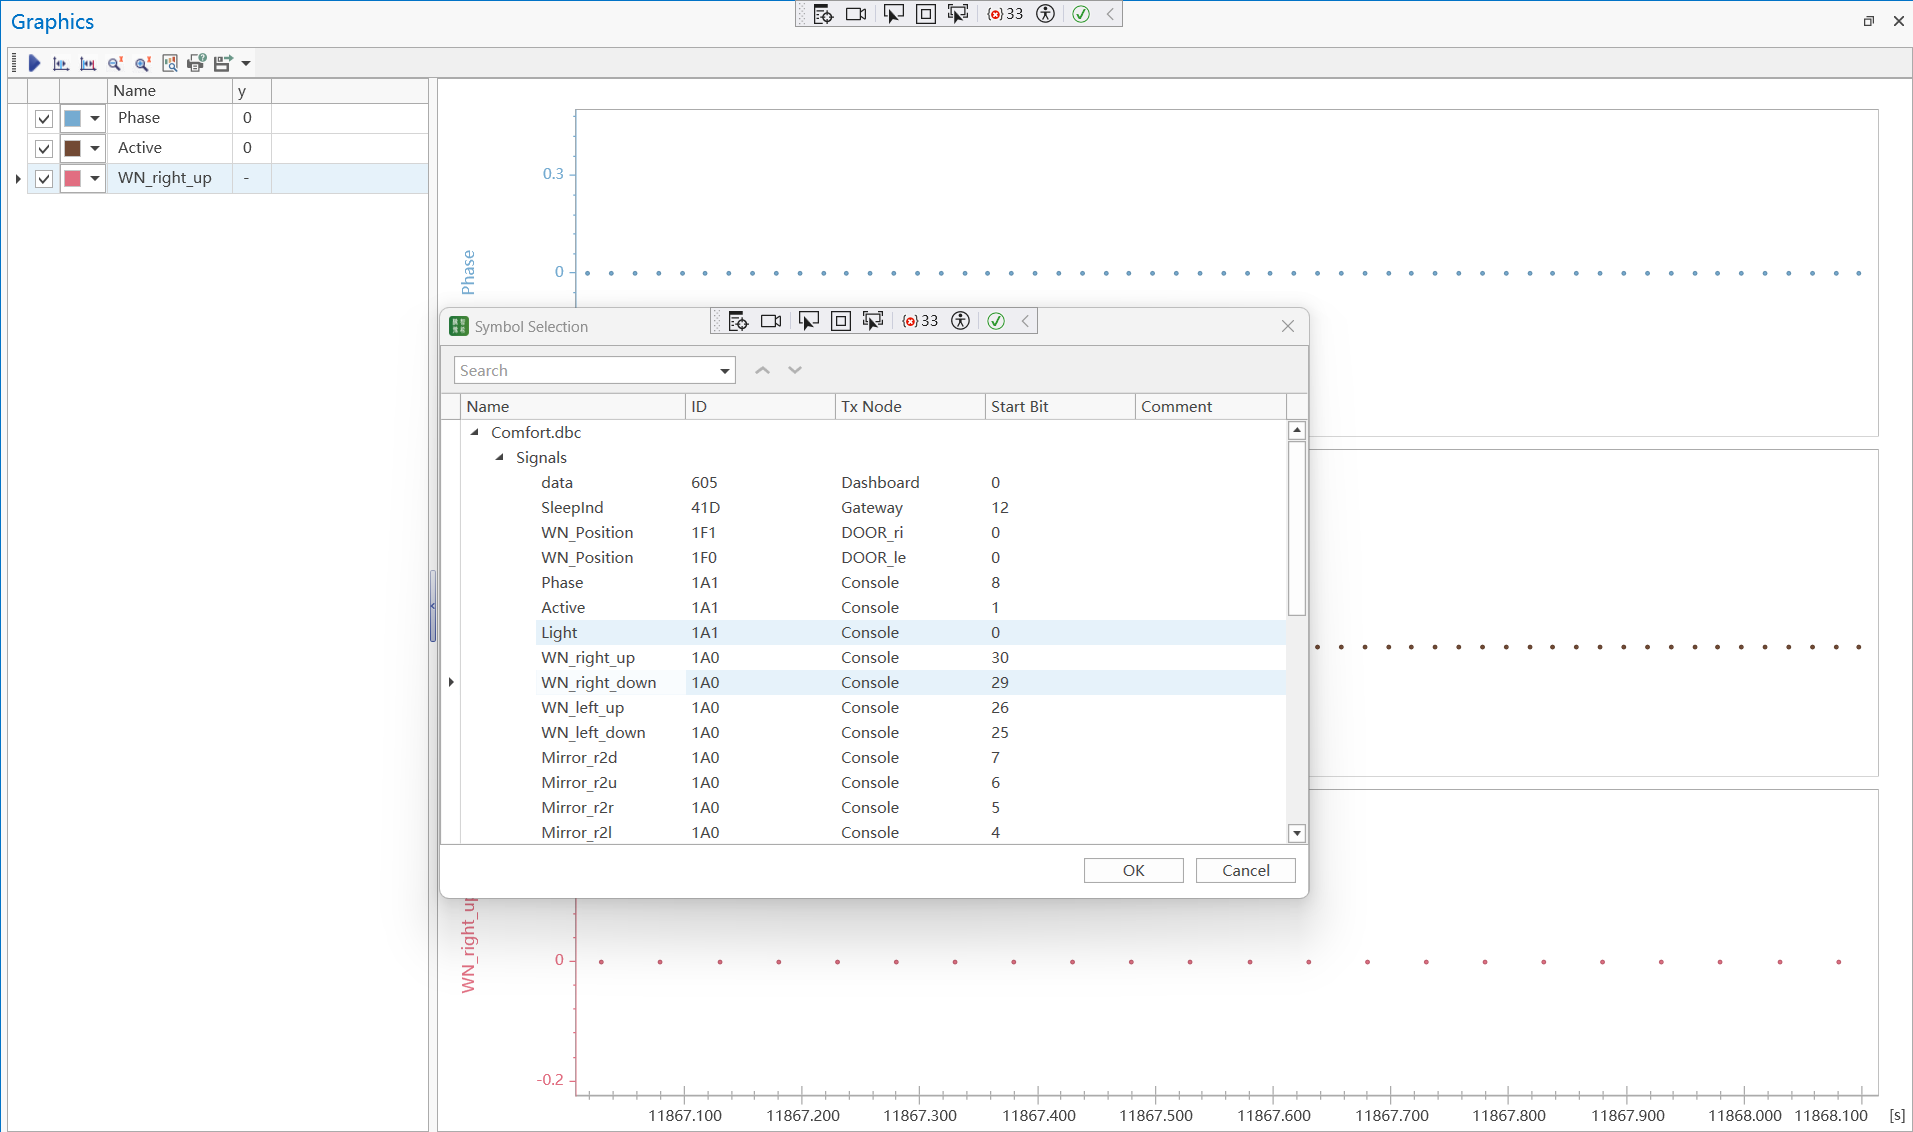
Figure 1-10
2-2:
Add LIN signals:Not implement yet.
2-3: Add system variables:
Click any blank point of left panel with mouse right button in Graphics chart, then select
Add Variablesin the popup menu. A dialog window will be opened, then choose the signals you want to observe and clickOKbutton. Finally the selected Variables will be added in Graphics chart left panel.2-4: Choose signal display style:
2-4-1: Line
Click any blank point of left panel with mouse right button in Graphics chart, then select
Connection Type -> Linein the popup menu. Then the data in Graphics chart will use line to display. See as Figure 1-11.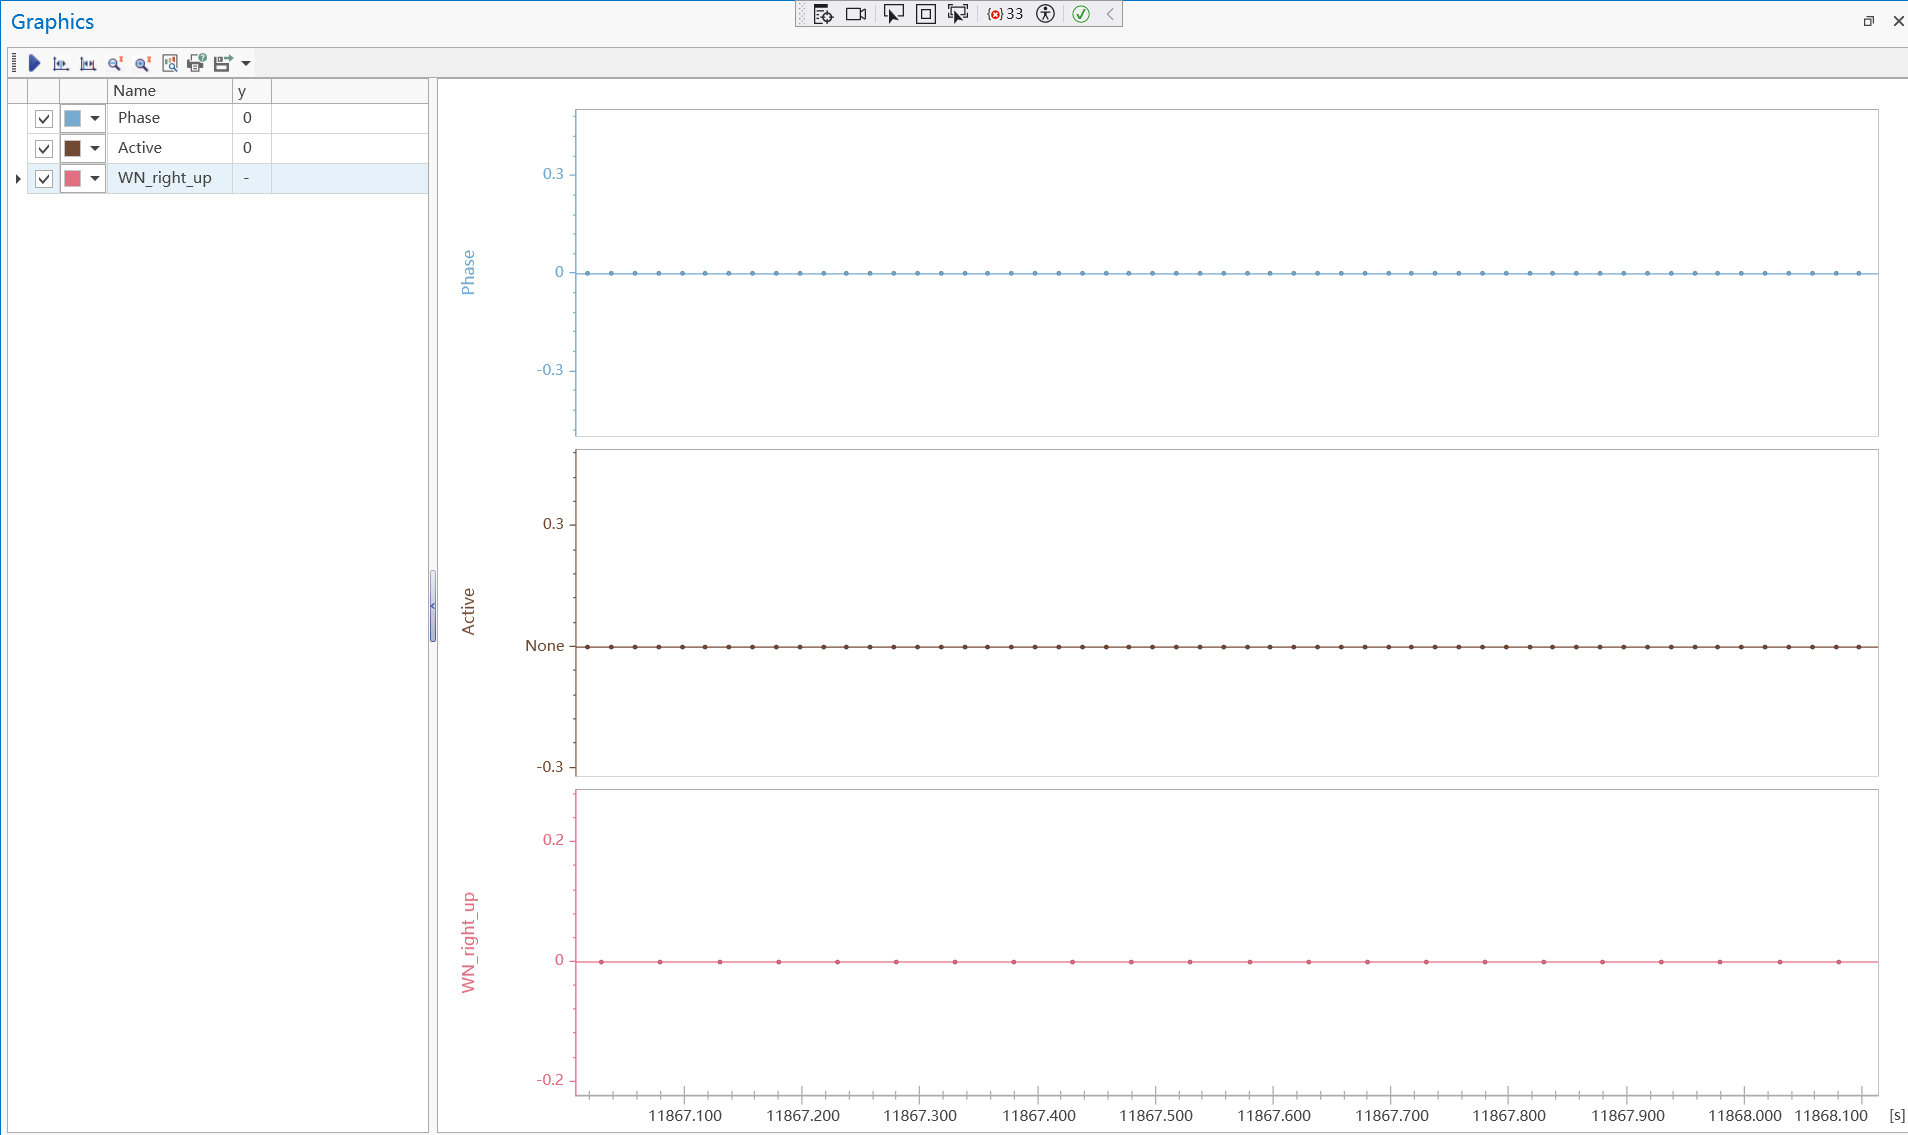 Figure 1-11
2-4-1: Steps
Click any blank point of left panel with mouse right button in Graphics chart, then select
Connection Type -> Stepsin the popup menu. Then the data in Graphics chart will use Steps to display.2-4-1: Dots
Click any blank point of left panel with mouse right button in Graphics chart, then select
Connection Type -> Dotsin the popup menu. Then the data in Graphics chart will use Dots to display.2-5: Crosshair:
Overview: Crosshair is used to inspect the data ponit values in Graphics, disregard the status of Graphics, namely can be used in both running and pause status.
2-5-1: Enable
Click any blank point of left panel with mouse right button in Graphics chart, then select
Crosshair -> Enablein the popup menu.2-5-2: Disable
Click any blank point of left panel with mouse right button in Graphics chart, then select
Crosshair -> Disablein the popup menu.2-6: Remove selected items
Choose the Items you want remove. Then click any blank point of left panel with mouse right button in Graphics chart, then select
Remove Selected Itemsin the popup menu. Finally the selected items will be removed from Graphics chart. User can remove single or mutiple items at once.2-7: Using assemble view
Click any blank point of left panel with mouse right button in Graphics chart, then select
Using assemble viewin the popup menu. Finally all the selected items will be shown in one diagram. See as Figure 1-12.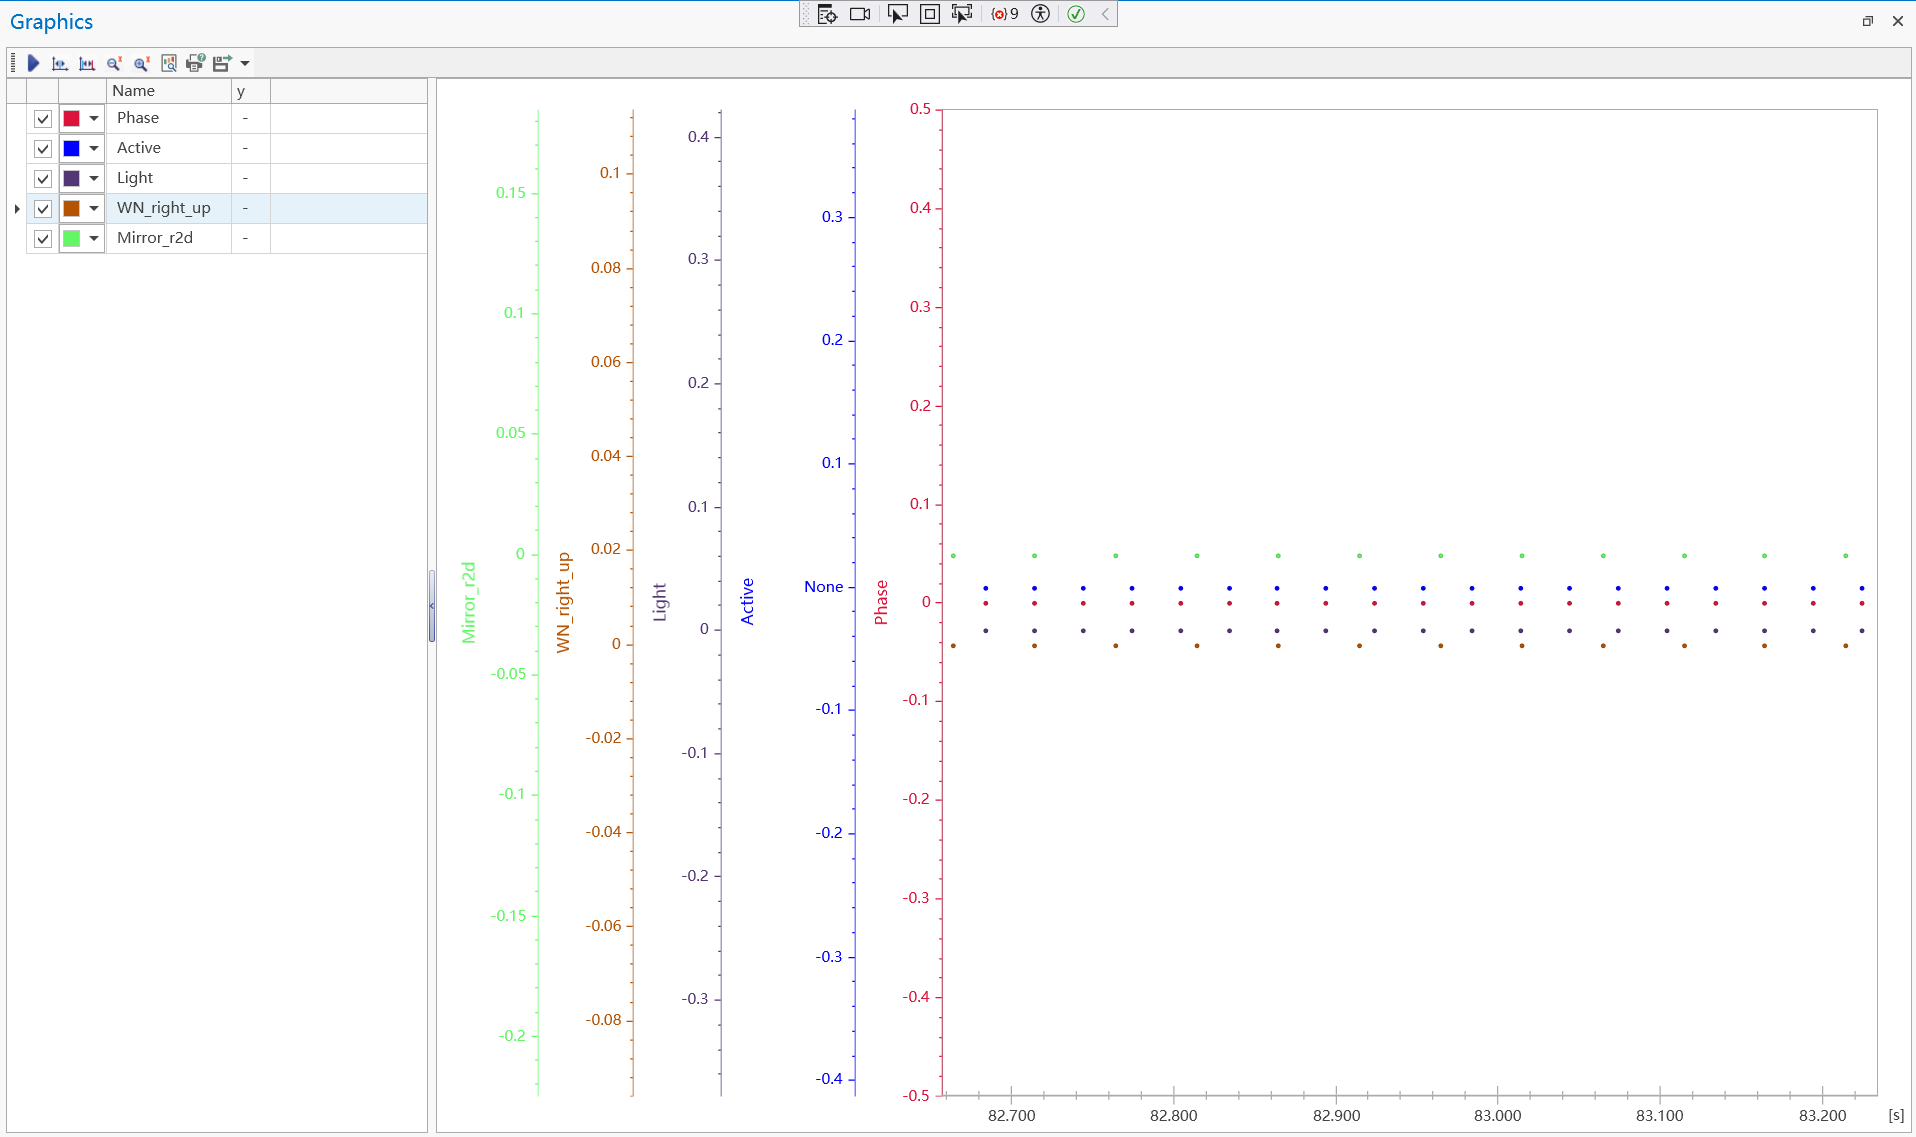
2-8: Using separated view
Click any blank point of left panel with mouse right button in Graphics chart, then select
Using separated viewin the popup menu. Finally all the selected items will be shown in separated diagram.