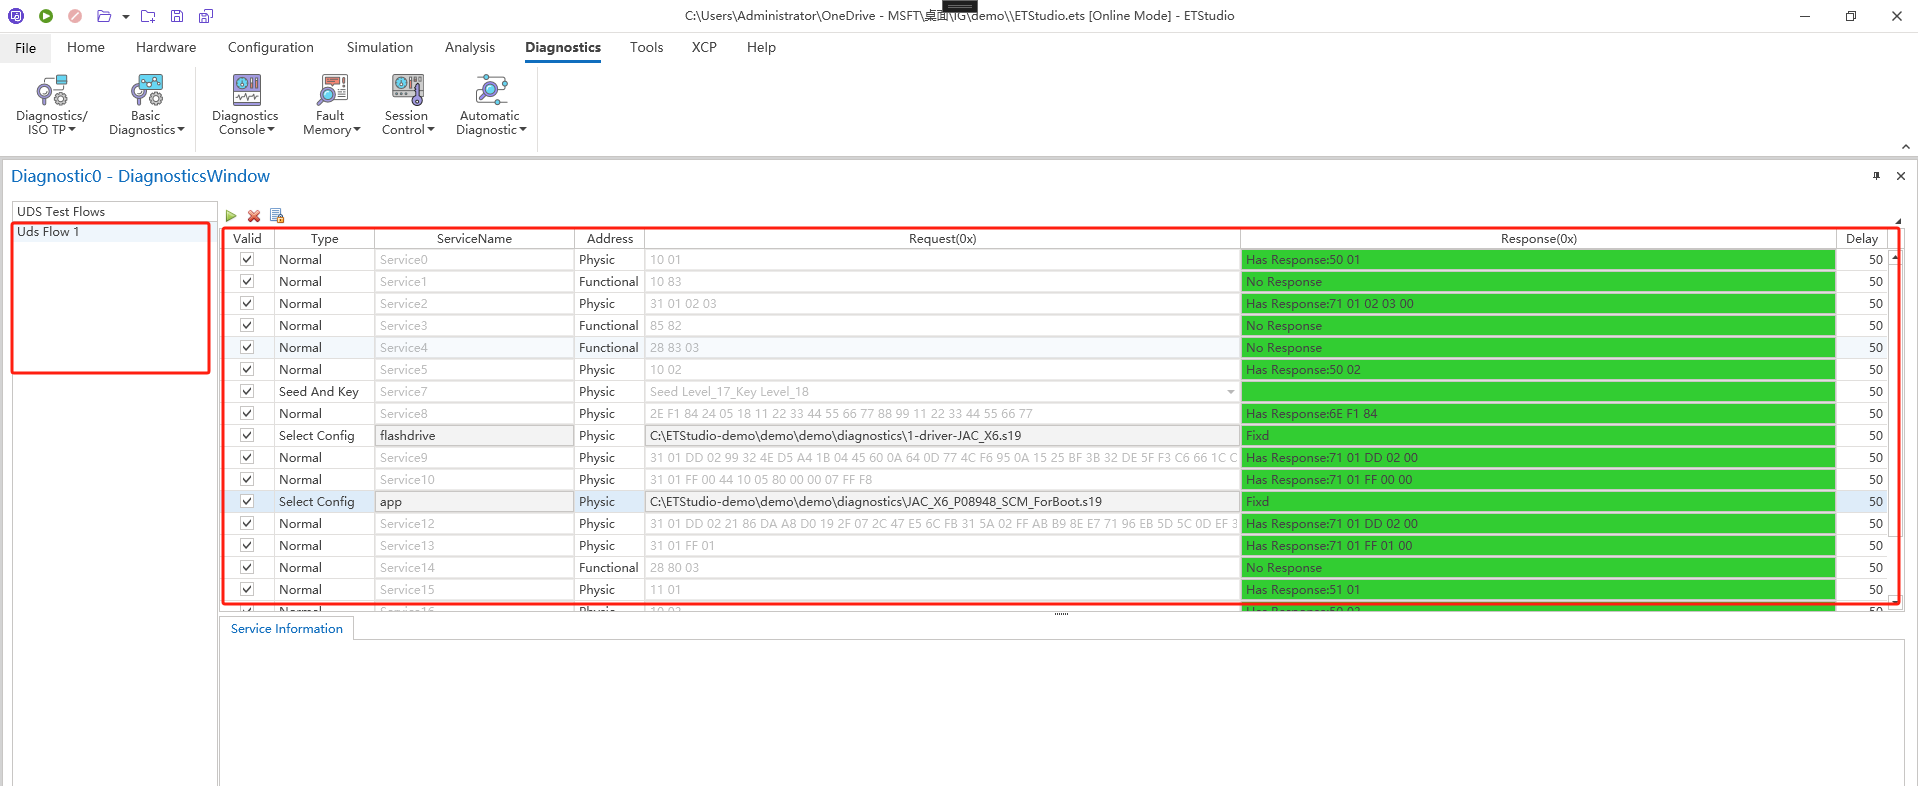
Automatic Diagnostics Process
Workflow Use Case Management
ETStudio's Automated Diagnostic Process is designed to streamline and manage diagnostic operations not just for individual applications but for the entire project lifecycle. Users can fully customize the diagnostic testing workflow to align with the project's specific requirements. The system provides an intuitive interface for configuring, executing, and monitoring diagnostic processes, ensuring efficiency and accuracy.
To access the Workflow Case Management menu, simply right-click on the UDS Process Management Bar. This will display a list of available operations, as illustrated below:
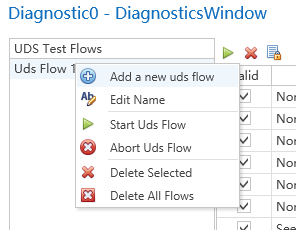
The main operations include:
-
Add a new Uds flow: Create a new diagnostic process case, under which users can define and organize detailed diagnostic steps.
-
Edit name: Select an existing process case, right-click, and choose "Edit Name" to modify the node's label for better clarity and organization.
-
Start Uds flow: Initiate the diagnostic process for the selected node. The system will automatically execute each diagnostic step in sequential order based on the pre-configured settings on the right panel.
-
Abort Uds flow: after clicking on this node, interrupt the diagnostic process step that is currently being executed.
-
Delete selected: delete the selected node.
-
Delete all flows: clear all nodes.
Configure the Diagnostic Process(UDS Flow)
Basic Configuration Steps
Configure the diagnostic process, the basic steps are shown in the figure below:
-
Select a diagnostic process node in the management panel on the left.
-
In the editing area on the right, add, delete, and edit diagnostic steps.
-
After adding a step, edit the step's name.
-
Select the type of the step.
-
Select the type of address for the step, whether it is a physical address or a functional address.
-
Configure the detailed diagnostic request and response data packets.
-
Configure the waiting time between steps after the completion of this step.
Toolbar
The diagnostic process configuration toolbar is shown in the figure below:
-
Start the configured diagnostic process.
-
Interrupt the diagnostic process that is currently running.
-
Toggles the editability of the diagnostic process settings to prevent accidental modifications.

Diagnostic Step Types
ETStudio supports four distinct step types, each catering to different diagnostic scenarios:

-
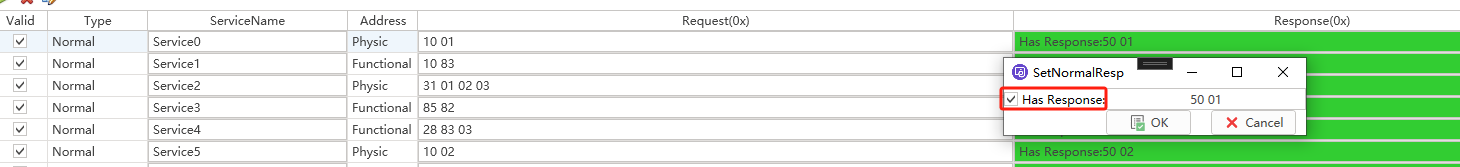
Normal Step
-
Best for: Simple diagnostic cases where both request and response data are predefined.
-
Example:
-
Request: 10 03
-
Expected Response: 50 03 12 34
-
Configuration:
Enter the request in the Request field and the expected response in the Response field.
If the ECU does not provide a response, simply uncheck "Has Response".
-
-
- SelectConfig: select an existing configuration. The purpose of this configuration is to allow users to select diagnostic steps that have already been debugged in the Diagnostic Console. The selection process is shown in the figure below:
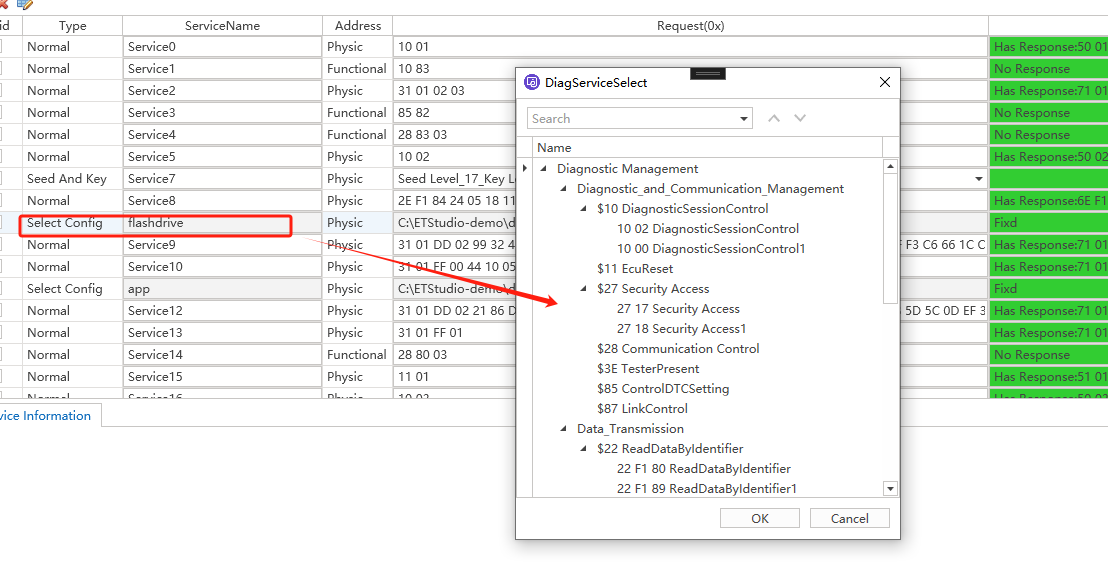
This method is the most recommended configuration approach by ETStudio. Users can first configure and test all the sub-processes in the Diagnostic Console, and then reference this configuration in the automatic diagnostic process.
During the execution of the automatic diagnostic process, its performance will be exactly the same as in the Diagnostic Console.
-
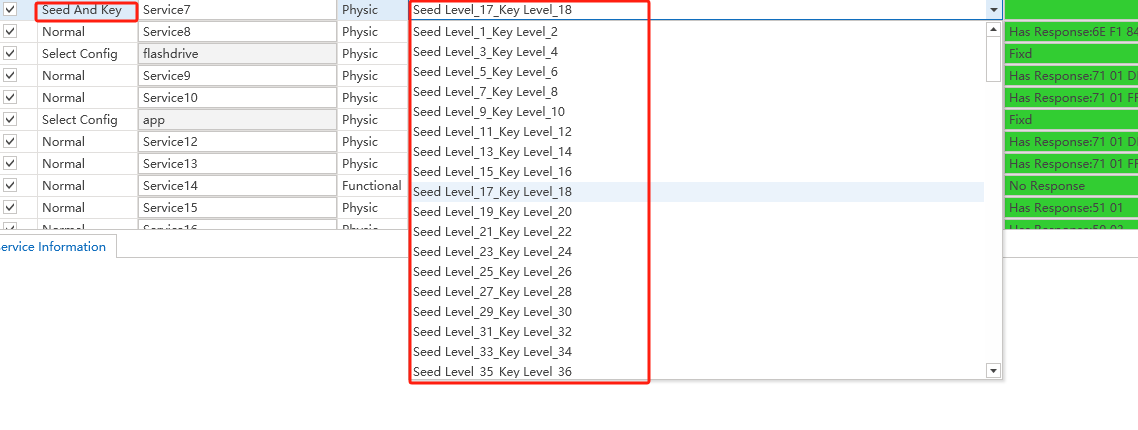
SeedAndKey Step
-
Purpose: Handles security authentication challenges requiring Seed & Key mechanisms.
-
Configuration Options:
-
Option A: Reference an existing SeedAndKey configuration via SelectConfig.
-
Option B: Directly configure within the automated process by selecting SeedAndKey type.
-
Key Parameter:
Only the SeedLevel needs to be specified.
The decryption DLL is automatically linked to the TP parameter configuration.
-
-
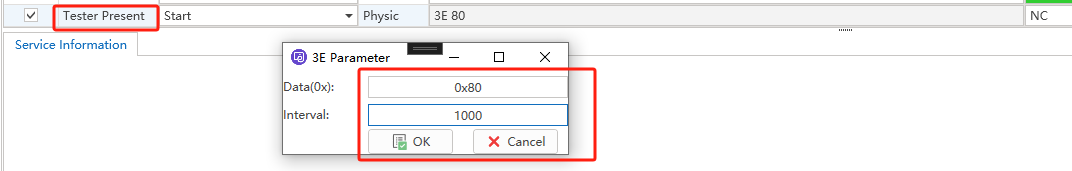
TesterPresent Step
-
Purpose: Provides flexibility in managing TesterPresent command activation/deactivation.
-
Configuration Parameters:
-
Enable/Disable Command: Toggle based on testing needs.
-
Command Data & Interval: Define the message content and transmission frequency.
-
-